Energy Hub gadgets (list)
Energy Hub uses gadgets to display energy, alarm, and status information. A gadget shows a chart, table, or grouping of information about a specific topic. You can find gadget data displays in the Investigate section of the Energy Hub user interface.
NOTE: Always consider the Safety Precautions when using information provided by Energy Hub for decision making.
Overview
There are different types of gadgets for displaying different types of information. Some information only applies to certain elements in the organization model. For example, electrical status information can be shown for equipment or monitoring devices, but not for buildings or floors.
The following lists the gadget types that are available in Energy Hub and the locations and items they can be used with in the organization model. The gadgets are grouped by information view.
| Gadget | Organization | Region | Site | Building | Floor | Area | Space | Production line | Zone | Equipment | Monitoring device |
|---|---|---|---|---|---|---|---|---|---|---|---|
|
Alarms summary |
■ | ■ | ■ | ■ | ■ | ■ | ■ | ■ | ■ | ■ | ■ |
|
Alarms by location |
■ | ■ | ■ | ■ | ■ | ■ | ■ | ■ | ■ |
- |
- |
|
Equipment status |
- | - | - | - | - | - | - | - | - | ■ | ■ |
|
Trends |
- | - | - | - | - | - | - | - | - | ■ | ■ |
| Gadget | Organization | Region | Site | Building | Floor | Area | Space | Production line | Zone | Monitoring device |
|---|---|---|---|---|---|---|---|---|---|---|
|
Energy flow |
■ | ■ | ■ | - | - | - | - | - | - | - |
|
Local generation (energy) (*) |
■ | ■ | ■ | - | - | - | - | - | - | - |
|
Energy consumption (and generation) |
■ | ■ | ■ | ■ | ■ | ■ | ■ | ■ | ■ | ■ |
|
Energy cost [Doughnut] |
■ | ■ | ■ | - | - | - | - | - | - | - |
|
Energy cost |
■ | ■ | ■ | ■ | ■ | ■ | ■ | ■ | ■ | ■ |
|
Energy consumption by usage type |
■ | ■ | ■ | ■ | ■ | ■ | ■ | ■ | ■ | - |
|
Energy consumption by location |
■ | ■ | ■ | ■ | ■ | ■ | ■ | ■ | ■ | - |
|
Energy consumption by business hours |
- | - | ■ | ■ | ■ | ■ | ■ | ■ | ■ | ■ |
|
Energy consumption by business hours and usage type |
- | - | ■ | ■ | ■ | ■ | ■ | ■ | ■ | ■ |
|
Energy consumption normalized by degree days |
- | - | ■ | ■ | ■ | ■ | ■ | ■ | ■ | ■ |
|
Energy consumption period-over-period comparison |
■ | ■ | ■ | ■ | ■ | ■ | ■ | ■ | ■ | ■ |
|
Energy intensity |
■ | ■ | ■ | ■ | ■ | ■ | ■ | - | ■ | - |
|
Energy intensity by location |
■ | ■ | ■ | ■ | ■ | ■ | ■ | - | ■ | - |
|
Demand |
■ | ■ | ■ | ■ | ■ | ■ | ■ | ■ | ■ | ■ |
|
Water consumption |
■ | ■ | ■ | ■ | ■ | ■ | ■ | ■ | ■ | ■ |
|
Water cost |
■ | ■ | ■ | ■ | ■ | ■ | ■ | ■ | ■ | ■ |
|
Water intensity |
■ | ■ | ■ | ■ | ■ | ■ | ■ | ■ | ■ | - |
|
Water intensity by location |
■ | ■ | ■ | ■ | ■ | ■ | ■ | ■ | ■ | - |
|
Gas consumption |
■ | ■ | ■ | ■ | ■ | ■ | ■ | ■ | ■ | ■ |
|
Gas cost |
■ | ■ | ■ | ■ | ■ | ■ | ■ | ■ | ■ | ■ |
(*) These gadgets are only displayed for organizations, regions, locations (site, building, ...), and devices with on-site generation.
| Gadget | Organization | Region | Site | Building | Floor | Area | Space | Production line | Zone | Asset | Monitoring device |
|---|---|---|---|---|---|---|---|---|---|---|---|
|
Alarms summary |
■ | ■ | ■ | - | - | - | - | - | - | - | - |
|
Alarms by location |
■ | ■ | ■ | - | - | - | - | - | - | - | - |
Gadget details
The following shows details for the gadgets that are available in Energy Hub. The gadgets are grouped by application.
General gadgets
NOTE: This gadget is available for all location types, equipment, and monitoring devices in the organization tree.
This gadget shows the alarms Energy Hub detected for the location selected in the organization tree. The information that is shown includes alarm counts, alarm status, and alarm details. To set the date range for the displayed information, use the date range selector in the Views navigation bar, in Investigate.
Examples (shown in dark mode):
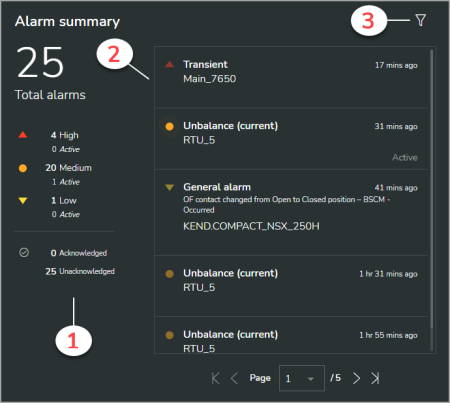
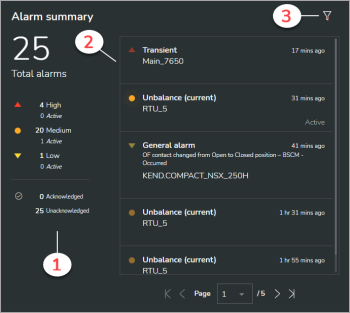
| 1 | Alarms summary | – | View the total number of alarms and the alarm break down by priority and acknowledgment state for the selected location and date range. NOTE: The alarms summary is hidden when the browser window size is small. |
| 2 | Alarms list | – | Select individual alarms from the list to see alarm details. |
| 3 | Alarms view filter | – | Select the priority, alarm state, and alarm category for the alarms that you want to see. |
Alarm details (select an alarm in the gadget to open the details dialog)
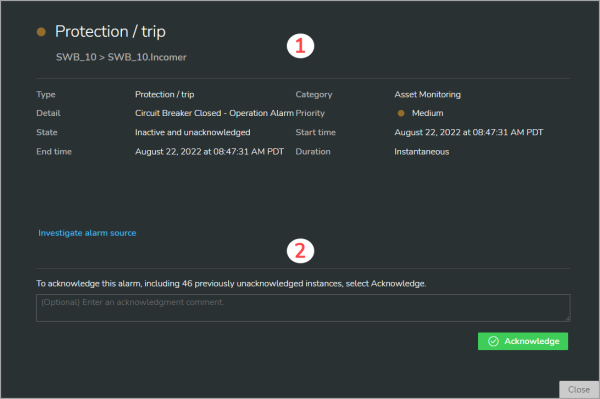

| 1 | Alarm details | – | View alarm details, such as start time and end time, classification, state, and duration. |
| 2 | Alarm acknowledgment section | – | Enter an optional acknowledgment comment and acknowledge the alarm. |
For more information on alarms, see Alarming.
NOTE: This gadget is available for all location types in the organization tree, such as sites, buildings, or floors. It is not available for equipment or monitoring devices.
This gadget shows the number of alarms Energy Hub detected for the child locations of the location selected in the organization tree. The data is displayed as a horizontal bar chart. The chart is ordered by alarm count, with the highest alarm count at the top. To set the date range for the displayed information, use the date range selector in the Views navigation bar, in Investigate.
NOTE: This display shows a maximum of 10 locations.
Example (shown in dark mode):
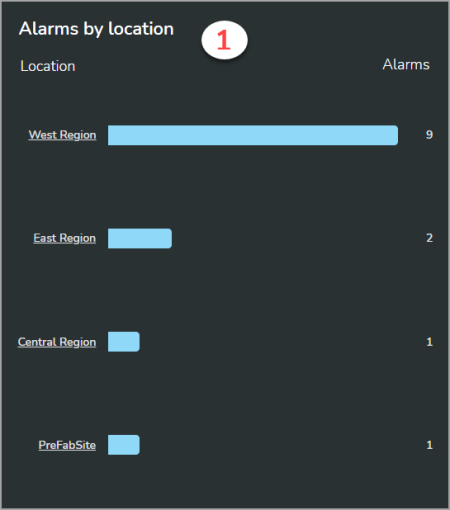

| 1 | Ordered alarm counts | – | View the number of alarms by location in a horizontal bar chart, ordered by alarm count. The locations shown are for the child locations of the location that you select in the organization tree. For example, if you select a building, you might see the alarm counts for its floors and areas. |
For more information on alarms, see Alarming.
NOTE: This gadget is only available for equipment and monitoring devices.
This gadget shows power system data for the selected equipment or monitoring device. The type of data that is available depends on the type of equipment and monitoring device that are providing the data.
IMPORTANT: The data shown in this display is not real-time data. The display shows the latest logged data for the equipment or monitoring device. Data updates can take up to 15 minutes.
Example
Power monitoring device
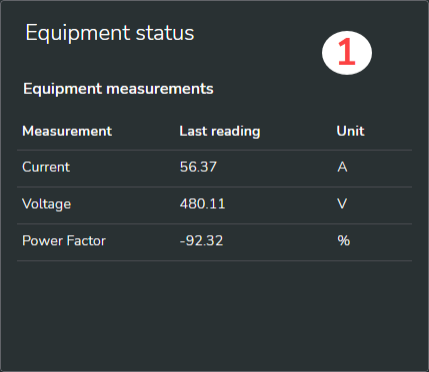
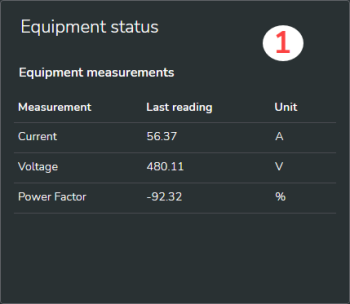
| 1 | Latest measurement data | – | View the latest readings for common measurements for the selected equipment or monitoring device. The number and types of measurements that are displayed depends on the monitoring device and equipment type. |
Breaker monitoring device
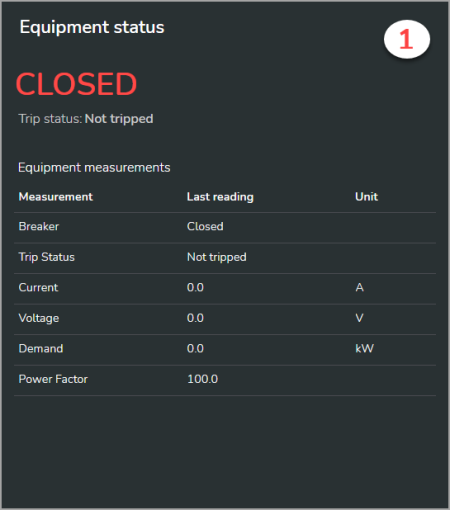

| 1 | Latest measurement data | – | View the latest readings for common measurements for the selected breaker. The number and types of measurements that are displayed depends on the breaker monitoring device. |
For more information on equipment, see Equipment, devices, and gateways.
NOTE: This gadget is only available for equipment and monitoring devices.
The trends gadget shows power system data trends for common measurements. The data is displayed as line charts. The type of data that is available depends on the type of equipment and monitoring device that are providing the data. To set the date range for the displayed information, use the date range selector in the Views navigation bar, in Investigate.
IMPORTANT: The data shown in this display is not real-time data. The display shows the latest logged data for the equipment or monitoring device. Data updates can take up to 15 minutes.
Example (shown in dark mode):
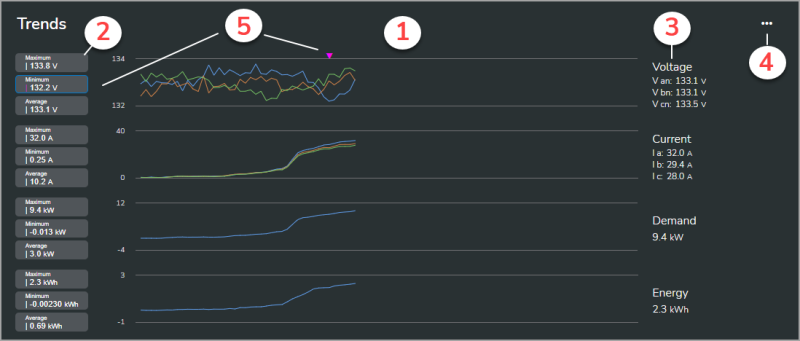
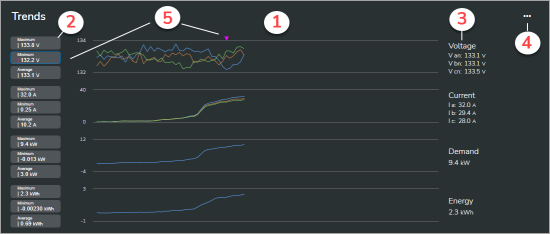
| 1 | Trend data | – | View power system data trends for common measurements such as voltage, current, power factor, demand, power, energy, frequency, THDi, and THDv for the selected equipment or monitoring device. The type of data that is displayed depends on the type of equipment that is being monitored and the monitoring device. |
| 2 | Trend statistics | – | View maximum, minimum, and average values for the selected trend date range. |
| 3 | Last readings | – | View the most recent readings for the displayed measurements. |
| 4 | Options menu | – | Select from available actions, for example 'Export data as CSV file'. |
| 5 | Display markers | – | Display markers on the trend line for maximum, minimum, and average values by selecting the respective buttons on the left. |
For more information on equipment, see Equipment, devices, and gateways.
Energy Analysis gadgets
Energy Analysis includes all the gadgets of Energy Code Compliance plus the following:
This gadget shows energy consumption categorized by open hours and closed hours for the business. The data is displayed as a vertical column chart. To set the date range for the displayed information, use the date range selector in the Views navigation bar, in Investigate.
TIP: To hide or show a series in the chart, select it in the chart legend.
Example (shown in dark mode):

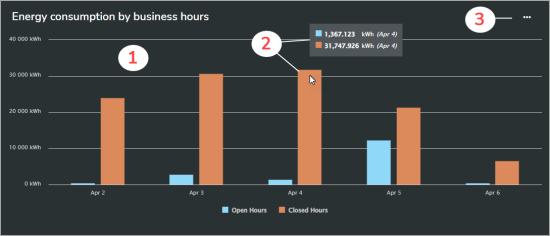
| 1 | Consumption trend | – | View the electric energy consumption trend by business hours for the selected location and date range. The gadget shows active energy (kWh) or apparent energy (kVAh), depending on the Energy mode setting for the selected location. For information on Energy Hub settings, see Settings list. NOTE: The time range for a column in the chart includes the end point and excludes the starting point. For example, in an hourly column chart, a column labeled 08:00 includes measurements taken after 08:00 up to those taken at 09:00. |
| 2 | Consumption details | – | Hover the pointer over a consumption column to see consumption details. |
| 3 | Options menu | – | Select from available actions, for example "Configure business hours' or 'Export data as CSV file'. |
For more information on Energy Analysis, see Energy Analysis.
This gadget shows energy consumption for the different usage types, categorized by open hours and closed hours for the business. The data is displayed as a combination of circular chart and horizontal bar chart. To set the date range for the displayed information, use the date range selector in the Views navigation bar, in Investigate.
Example (shown in dark mode):

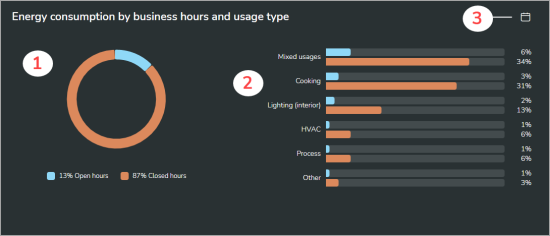
| 1 | Consumption total | – | View the total electric energy consumption by business hours for the selected location and date range. The gadget shows active energy (kWh) or apparent energy (kVAh), depending on the Energy mode setting for the selected location. For information on Energy Hub settings, see Settings list. |
| 2 | Consumption details | – | View the energy consumption categorized by energy usage type for the selected location and date range. Hover the pointer over the doughnut chart or a consumption bar to see details. |
| 3 | Business hours schedule | – | Open the business hours schedule editor. |
For more information on Energy Analysis, see Energy Analysis.
This gadget shows energy consumption normalized by heating degree days (HDD) and cooling degree days (CDD) based on climate data for your local area. The data is displayed as a line chart. To set the date range for the displayed information, use the date range selector in the Views navigation bar, in Investigate.
TIP: To hide or show the average daily outside temperature in the chart, select it in the chart legend.
NOTE: Degree day data is calculated at the end of each day. That means you can view normalized consumption trends for past days but not for the current day.
Example (shown in dark mode):
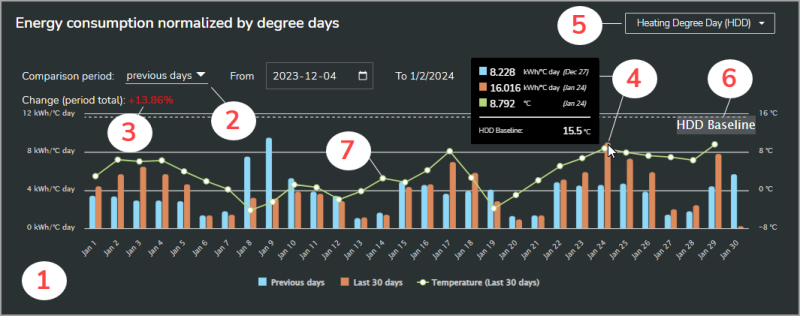

| 1 | Consumption trend | – | View the normalized electric energy consumption trend for the selected location and date range, and compare it to a previous time period. You can set the chart date range with the date range selector in the Views navigation bar. You set the comparison period with the comparison period selector. The gadget shows active energy (kWh) or apparent energy (kVAh), depending on the Energy mode setting for the selected location. For information on Energy Hub settings, see Settings list. |
| 2 | Comparison period selector | – | Select the past time period that you want to compare the current consumption to. |
| 3 | Consumption change | – | View the change in energy consumption compared to the past period for the selected location and date range. |
| 4 | Consumption details | – | Hover the pointer over a consumption column to see consumption details. |
| 5 | Degree day selector | – | Select the normalization reference as HDD + CDD, CDD, or HDD. |
| 6 | Baseline | – | HDD or CDD baseline. |
| 7 | Temperature | – | Average daily outside temperature . |
For more information on Energy Analysis, see Energy Analysis.
This gadget shows energy consumption compared to that of previous time periods. The data is displayed as a vertical column chart. To set the date range for the displayed information, use the date range selector in the Views navigation bar, in Investigate.
Example (shown in dark mode):
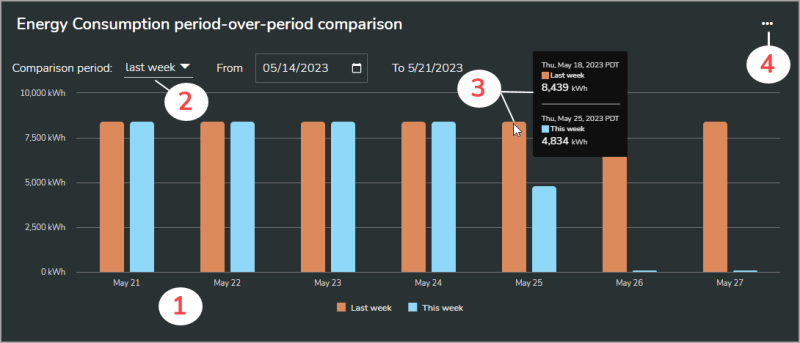

| 1 | Consumption trend | – |
View the electric energy consumption trend for the selected location and date range, and compare it to a previous time period. You can set the chart date range with the date range selector in the Views navigation bar. You set the comparison period with the comparison period selector. NOTE: The time range for a column in the chart includes the end point and excludes the starting point. For example, in an hourly column chart, a column labeled 08:00 includes measurements taken after 08:00 up to those taken at 09:00. |
| 2 | Comparison period selector | – | Select the past time period that you want to compare the current consumption to. For week and month comparisons, the gadget chooses the matching weekdays that are closest to the selected past comparison period. For example, for a comparison of May with April, where May 1 is a Monday, the gadget starts the past comparison period on April 3, the first Monday in April. You can adjust the past comparison period start date with the date selector in the gadget. |
| 3 | Consumption details | – | Hover the pointer over a consumption column to see consumption details. |
| 4 | Options menu | – | Select from available actions, for example 'Export data as CSV file'. |
For more information on Energy Analysis, see Energy Analysis.
Energy Code Compliance gadgets
Energy Code Compliance gadgets
This gadget shows the energy flow from sources to consumers for your facilities. The data is displayed as a Sankey flow diagram. To set the date range for the displayed information, use the date range selector in the Views navigation bar, in Investigate.
Example (shown in dark mode):
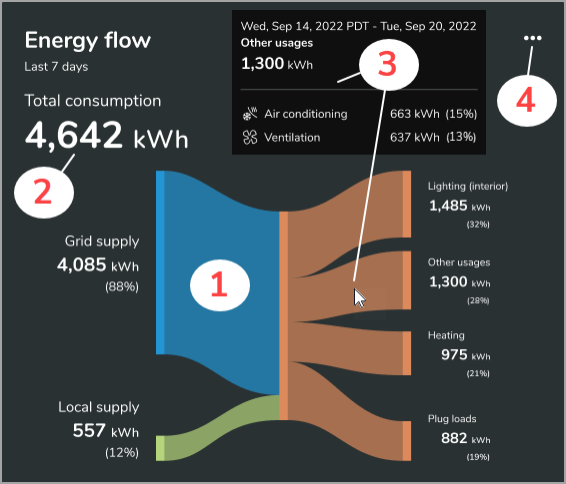

| 1 | Energy flow | – | View the electric energy supply and consumption for the selected location and date range. The diagram shows up to four consumption usage types. If there are five or more usage types, the gadget shows the top three and groups the remaining usages together as Other usages. The gadget shows active energy (kWh) or apparent energy (kVAh), depending on the Energy mode setting for the selected location. For information on Energy Hub settings, see Settings list. |
| 2 | Consumption total | – | View the total energy consumption for the selected location and date range. |
| 3 | Consumption details | – | Hover the pointer over the total consumption, supply, or usage types to see details. The details for the Other usages show the specific energy usage types included in this grouping. |
| 4 | Options menu | – | Select from available actions, for example 'Export data as CSV file'. |
For more information on Energy Code Compliance, see Energy Code Compliance.
This gadget shows the total on-site generated energy and how much of it was used locally and sent to the utility grid. The data is displayed as a horizontal bar chart. To set the date range for the displayed information, use the date range selector in the Views navigation bar, in Investigate.
NOTE: This gadget is only displayed for organizations with on-site generation.
Example (shown in dark mode):
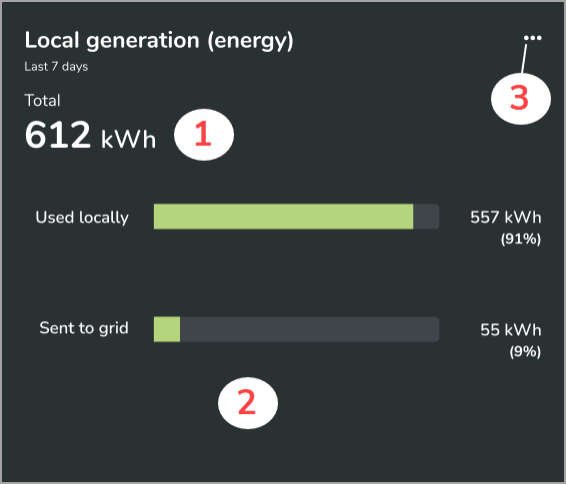

| 1 | Generation total | – | View how much energy was generated locally for the selected location and date range. Hover the pointer over the total value to see details. The gadget shows active energy (kWh) or apparent energy (kVAh), depending on the Energy mode setting for the selected location. For information on Energy Hub settings, see Settings list. |
| 2 | Local generation | – | View how much of the on-site generated energy was used locally and how much was sent to the utility. Hover the pointer over the bars to see details. |
| 3 | Options menu | – | Select from available actions, for example 'Export data as CSV file'. |
For more information on Energy Code Compliance, see Energy Code Compliance.
This gadget shows different types of information depending on the type of energy supply.
Systems with energy supplied by the utility (= single supply source).
The gadget shows energy consumption trends and totals. The data is displayed as a vertical column chart. To set the date range for the displayed information, use the date range selector in the Views navigation bar, in Investigate.
Example (shown in dark mode):
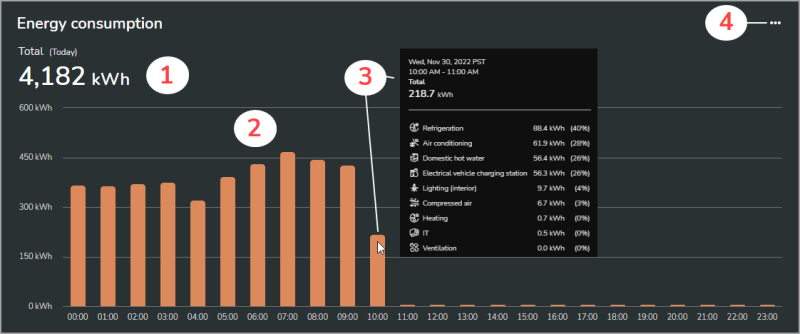

| 1 | Total | – | View the total energy consumption for the selected location and date range. The gadget shows active energy (kWh) or apparent energy (kVAh), depending on the Energy mode setting for the selected location. For information on Energy Hub settings, see Settings list. |
| 2 | Trend | – | View the electric energy consumption trend for the selected location and date range. NOTE: The time range for a column in the chart includes the end point and excludes the starting point. For example, in an hourly column chart, a column labeled 08:00 includes measurements taken after 08:00 up to those taken at 09:00. |
| 3 | Details | – | Hover the pointer over the total value or a consumption column to see consumption details. |
| 4 | Options menu | – | Select from available actions, for example 'Export data as CSV file'. |
Systems with energy supplied by the utility and on-site generation.
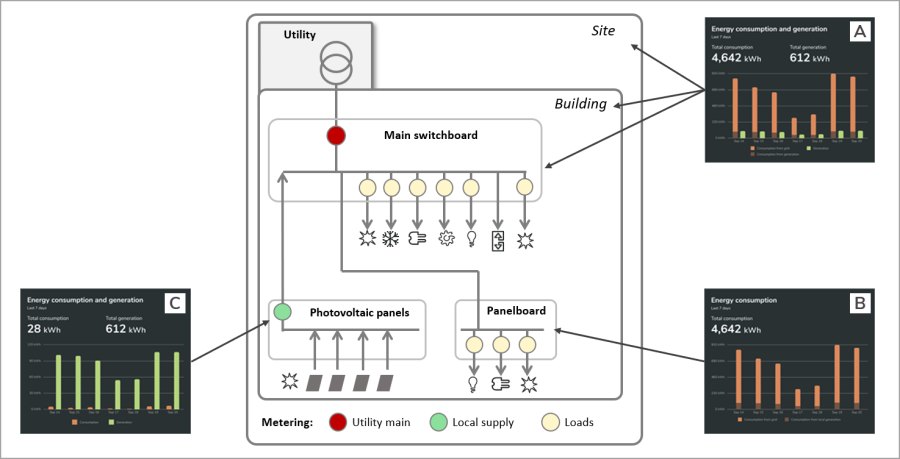
(A) At the organization, region, site, and building level, the gadget shows energy consumption and generation trends and totals.
(B) For locations below the building level, it shows only consumption, categorized by grid supply and local supply.
(C) For devices that are monitoring the local generation, it shows energy consumption and generation without categorization.
The data is displayed as a vertical column chart. To set the date range for the displayed information, use the date range selector in the Views navigation bar, in Investigate.
TIP: To hide or show a series in the chart, select it in the chart legend.
A - Gadget display at the organization, region, site, and building level:
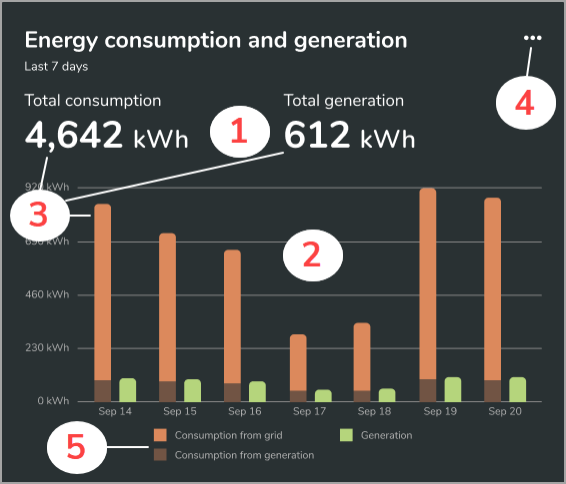
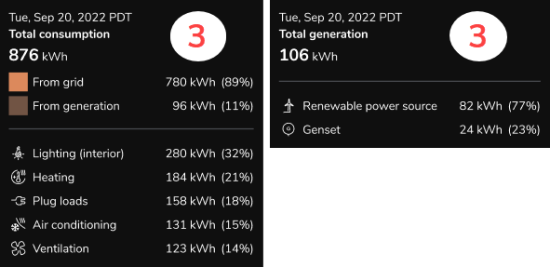
| 1 | Totals | – | View the total energy consumption and generation for the selected location and date range. The gadget shows active energy (kWh) or apparent energy (kVAh), depending on the Energy mode setting for the selected location. For information on Energy Hub settings, see Settings list. |
| 2 | Trends | – | View the electric energy consumption and generation trends for the selected location and date range. NOTE: The time range for a column in the chart includes the end point and excludes the starting point. For example, in an hourly column chart, a column labeled 08:00 includes measurements taken after 08:00 up to those taken at 09:00. |
| 3 | Details | – | Hover the pointer over the total values or a consumption column to see consumption details. |
| 4 | Options menu | – | Select from available actions, for example 'Export data as CSV file'. |
| 5 | Consumption by source | – | View energy consumption categorized by supply source. |
B - Gadget display at locations below the building level:
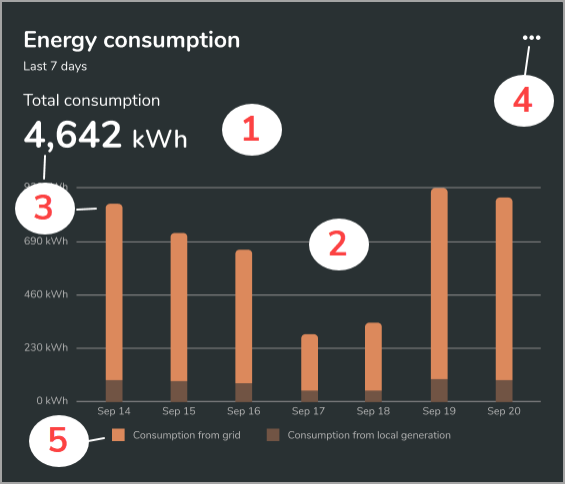

| 1 | Total | – | View the total energy consumption for the selected location and date range. The gadget shows active energy (kWh) or apparent energy (kVAh), depending on the Energy mode setting for the selected location. For information on Energy Hub settings, see Settings list. |
| 2 | Trend | – | View the electric energy consumption trend for the selected location and date range. NOTE: The time range for a column in the chart includes the end point and excludes the starting point. For example, in an hourly column chart, a column labeled 08:00 includes measurements taken after 08:00 up to those taken at 09:00. |
| 3 | Details | – | Hover the pointer over the total value or a consumption column to see consumption details. |
| 4 | Options menu | – | Select from available actions, for example 'Export data as CSV file'. |
| 5 | Consumption by source | – | View energy consumption categorized by supply source. |
C - Gadget display for devices that are monitoring the local generation:
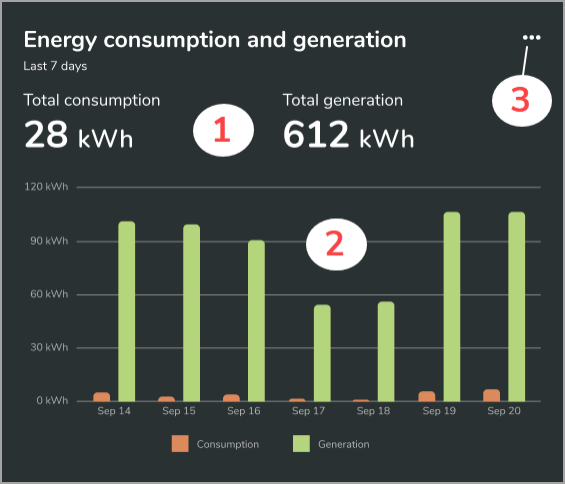
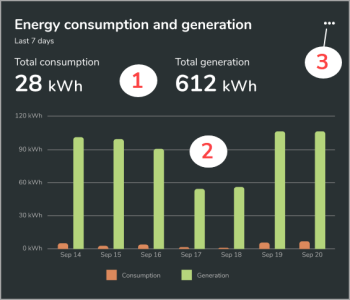
| 1 | Totals | – | View the total energy consumption and generation for the selected device and date range. The gadget shows active energy (kWh) or apparent energy (kVAh), depending on the Energy mode setting for the selected location. For information on Energy Hub settings, see Settings list. |
| 2 | Trends | – | View electric energy consumption and generation trends for the device monitoring local generation. NOTE: The time range for a column in the chart includes the end point and excludes the starting point. For example, in an hourly column chart, a column labeled 08:00 includes measurements taken after 08:00 up to those taken at 09:00. |
| 3 | Options menu | – | Select from available actions, for example 'Export data as CSV file'. |
The illustration below shows the different gadget display types for different locations in the organization model:
For more information on Energy Code Compliance, see Energy Code Compliance.
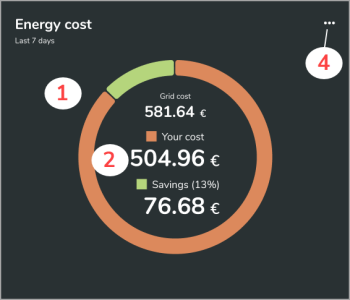
This gadget shows energy cost trends and totals. The data is displayed as a vertical column chart. At the organization, region, and site level the gadget displays as a doughnut chart. To set the date range for the displayed information, use the date range selector in the Views navigation bar, in Investigate.
Examples (shown in dark mode):
A doughnut chart is displayed at the organization, region, and site level.

A column chart is displayed for all locations below site level.
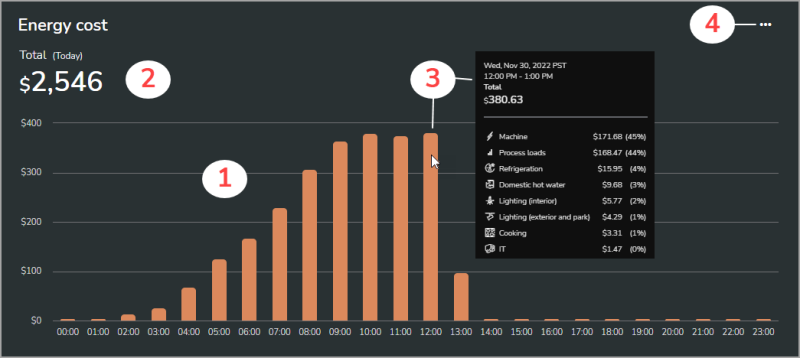
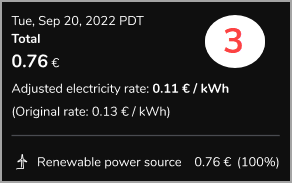

| 1 | Cost trend | – | View the electric energy consumption cost trend for the selected location and date range. At the organization, region, and site level the gadget displays as a doughnut chart. The gadget shows cost for active energy (kWh) or apparent energy (kVAh), depending on the Energy mode setting for the selected location. For information on Energy Hub settings, see Settings list. NOTE: The time range for a column in the chart includes the end point and excludes the starting point. For example, in an hourly column chart, a column labeled 08:00 includes measurements taken after 08:00 up to those taken at 09:00. |
| 2 | Cost total | – | View the cost for the total energy consumption for the selected location and date range. For systems with on-site generation, the doughnut chart displays electric energy consumption cost and on-site generation savings. |
| 3 | Cost details | – | Hover the pointer over the total values or a cost column to see details. For systems with on-site generation, the details for the total cost in the column chart show an adjusted electricity rate to account for the use of on-site generation. |
| 4 | Options menu | – | Select from available actions, for example 'Export data as CSV file'. |
For more information on Energy Code Compliance, see Energy Code Compliance.
This gadget shows the energy consumption for different usages for the location selected in the organization tree. The data is displayed as a horizontal bar chart. The chart is ordered by consumption, with the highest consumption at the top. To set the date range for the displayed information, use the date range selector in the Views navigation bar, in Investigate.
NOTE: The display shows a maximum of 10 usage types.
Example (shown in dark mode):

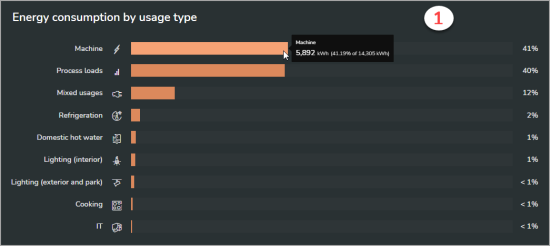
| 1 | Consumption by usage type | – | View energy consumption ordered from highest to lowest for the selected location and date range. The gadget shows active energy (kWh) or apparent energy (kVAh), depending on the Energy mode setting for the selected location. For information on Energy Hub settings, see Settings list. |
For more information on Energy Code Compliance, see Energy Code Compliance.
This gadget shows energy consumption for the child locations of the location selected in the organization tree. The data is displayed as a horizontal bar chart. You can order the chart from high to low or low to high consumption. To set the date range for the displayed information, use the date range selector in the Views navigation bar, in Investigate.
NOTE: This display shows a maximum of 10 locations.
Example (shown in dark mode):
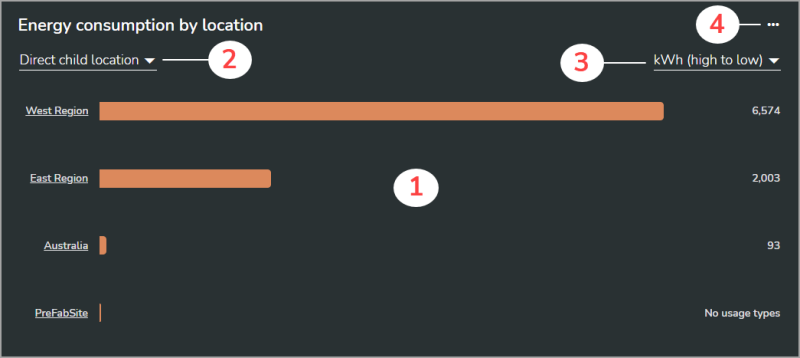
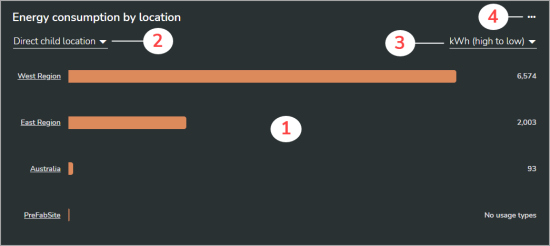
| 1 | Consumption by location | – | View energy consumption for the child locations of the location that you select in the organization tree. For example, if you select a building, you might want to see the energy consumption for all of its floors. The gadget shows active energy (kWh) or apparent energy (kVAh), depending on the Energy mode setting for the selected location. For information on Energy Hub settings, see Settings list. |
| 2 | Location selector | – | Select the type of location for which you want to see energy consumption. Available options: Direct child location, Region, Site, Building, Floor, Area, Space, Production line, Zone, Devices. |
| 3 | Sort order selector | – | Select the order in which the locations are ordered, high to low or low to high intensity. |
| 4 | Options menu | – | Select from available actions, for example 'Export data as CSV file'. |
For more information on Energy Code Compliance, see Energy Code Compliance.
This gadget shows energy usage per floor area for the location selected in the organization tree. The data is displayed as a vertical column chart. To set the date range for the displayed information, use the date range selector in the Views navigation bar, in Investigate.
Example (shown in dark mode):
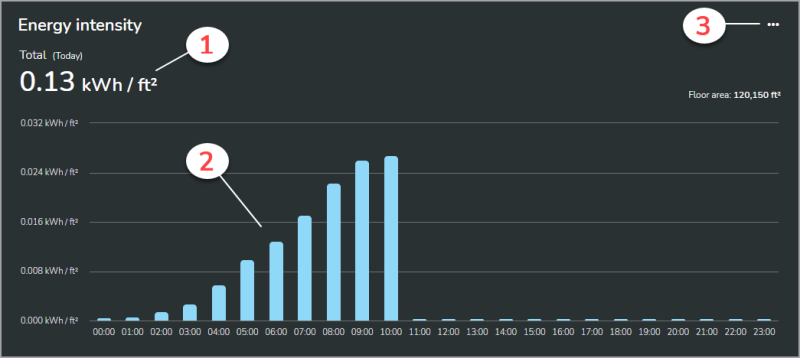

| 1 | Total intensity | – | View the total energy intensity for the selected location and date range. The gadget shows active energy (kWh) or apparent energy (kVAh), depending on the Energy mode setting for the selected location. For information on Energy Hub settings, see Settings list. |
| 2 | Intensity trend | – | View the electric energy intensity trend for a site, a building, or any other location selected in the organization tree. NOTE: The time range for a column in the chart includes the end point and excludes the starting point. For example, in an hourly column chart, a column labeled 08:00 includes measurements taken after 08:00 up to those taken at 09:00. |
| 3 | Options menu | – | Select from available actions, for example 'Export data as CSV file'. |
For more information on Energy Code Compliance, see Energy Code Compliance.
This gadget shows energy intensity for the child locations of the location selected in the organization tree. The data is displayed as a horizontal bar chart. You can order the chart from high to low or low to high intensity. To set the date range for the displayed information, use the date range selector in the Views navigation bar, in Investigate.
NOTE: This display shows a maximum of 10 locations.
Example (shown in dark mode):
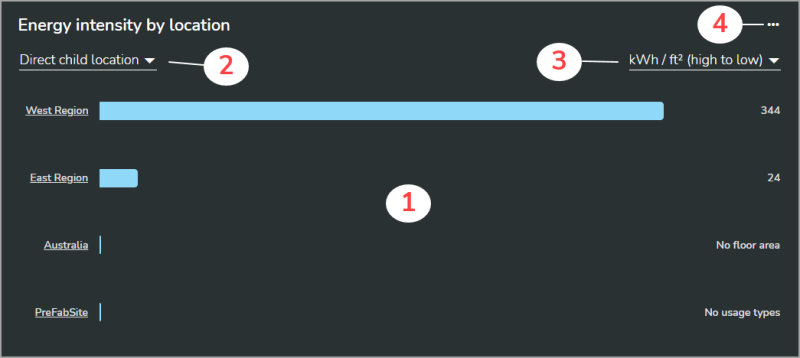

| 1 | Intensity by location | – | View energy intensity for the child locations of the location that you select in the organization tree. For example, if you select a building, you might want to see the energy intensity for all of its floors. The gadget shows active energy (kWh) or apparent energy (kVAh), depending on the Energy mode setting for the selected location. For information on Energy Hub settings, see Settings list. |
| 2 | Child location selector | – | Select the type of child location for which you want to see energy intensity. The available options for child locations depend on the selected parent location and can include: Direct child location, Region, Site, Building, Floor, Area, Space, Production line, Zone, Devices. |
| 3 | Sort order selector | – | Select the order in which the child locations are ordered, high to low or low to high intensity. |
| 4 | Options menu | – | Select from available actions, for example 'Export data as CSV file'. |
For more information on Energy Code Compliance, see Energy Code Compliance.
This gadget shows electric power demand. The data is displayed as a vertical column chart. Each column in the chart shows the peak demand for the corresponding time interval for the selected location and date range. To set the date range for the displayed information, use the date range selector in the Views navigation bar, in Investigate.
NOTE: This display shows power data if demand data is not available.
Example (shown in dark mode):

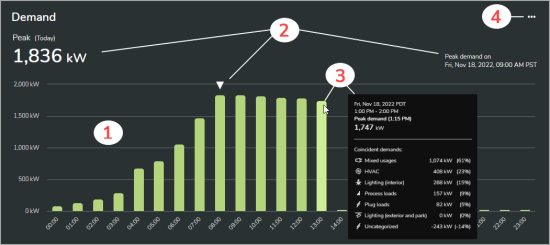
| 1 | Demand trend | – | View the electric power demand trend for the selected location and date range. The gadget shows active power (kW) or apparent power (kVA), depending on the Energy mode setting for the selected location. For information on Energy Hub settings, see Settings list. NOTE: The time range for a column in the chart includes the end point and excludes the starting point. For example, in an hourly column chart, a column labeled 08:00 includes measurements taken after 08:00 up to those taken at 09:00. |
| 2 | Peak demand | – | View the peak demand for the selected date range. |
| 3 | Demand details | – | Hover the pointer over the peak value or a column to see details. |
| 4 | Options menu | – | Select from available actions, for example 'Export data as CSV file'. |
For more information on Energy Code Compliance, see Energy Code Compliance.
This gadget shows water consumption trends and totals. The data is displayed as a vertical column chart. To set the date range for the displayed information, use the date range selector in the Views navigation bar, in Investigate.
Example (shown in dark mode):
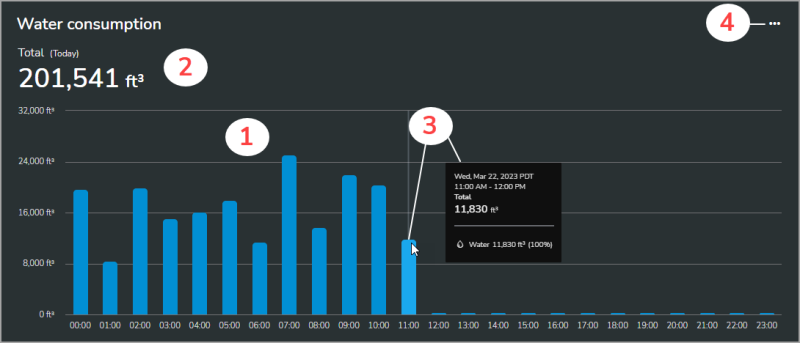

| 1 | Consumption trend | – | View the water consumption trend for the selected location and date range. NOTE: The time range for a column in the chart includes the end point and excludes the starting point. For example, in an hourly column chart, a column labeled 08:00 includes measurements taken after 08:00 up to those taken at 09:00. |
| 2 | Consumption total | – | View the total water consumption for the selected location and date range. |
| 3 | Consumption details | – | Hover the pointer over the total value or a consumption column to see details. |
| 4 | Options menu | – | Select from available actions, for example 'Export data as CSV file'. |
For more information on Energy Code Compliance, see Energy Code Compliance.
This gadget shows water cost trends and totals. The data is displayed as a vertical column chart. To set the date range for the displayed information, use the date range selector in the Views navigation bar, in Investigate.
Example (shown in dark mode):


| 1 | Cost trend | – | View the water consumption cost trend for the selected location and date range. NOTE: The time range for a column in the chart includes the end point and excludes the starting point. For example, in an hourly column chart, a column labeled 08:00 includes measurements taken after 08:00 up to those taken at 09:00. |
| 2 | Cost total | – | View the cost for the total water consumption for the selected location and date range. |
| 3 | Cost details | – | Hover the pointer over the total value or a cost column to see details. |
| 4 | Options menu | – | Select from available actions, for example 'Export data as CSV file'. |
For more information on Energy Code Compliance, see Energy Code Compliance.
This gadget shows water use intensity for the location selected in the organization tree. The data is displayed as a vertical column chart. To set the date range for the displayed information, use the date range selector in the Views navigation bar, in Investigate.
Example (shown in dark mode):

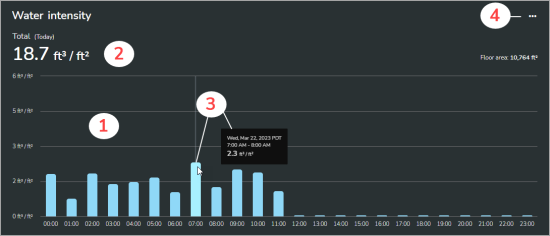
| 1 | Intensity trend | – | View the water use intensity trend for the selected location and date range. NOTE: The time range for a column in the chart includes the end point and excludes the starting point. For example, in an hourly column chart, a column labeled 08:00 includes measurements taken after 08:00 up to those taken at 09:00. |
| 2 | Total intensity | – | View the total water use intensity for the selected location and date range. |
| 3 | Intensity details | – | Hover the pointer over the total value or an intensity column to see details. |
| 4 | Options menu | – | Select from available actions, for example 'Export data as CSV file'. |
For more information on Energy Code Compliance, see Energy Code Compliance.
This gadget shows water use intensity for the child locations of the location selected in the organization tree. The data is displayed as a horizontal bar chart. You can order the chart from high to low or low to high intensity. To set the date range for the displayed information, use the date range selector in the Views navigation bar, in Investigate.
NOTE: This display shows a maximum of 10 locations.
Example (shown in dark mode):
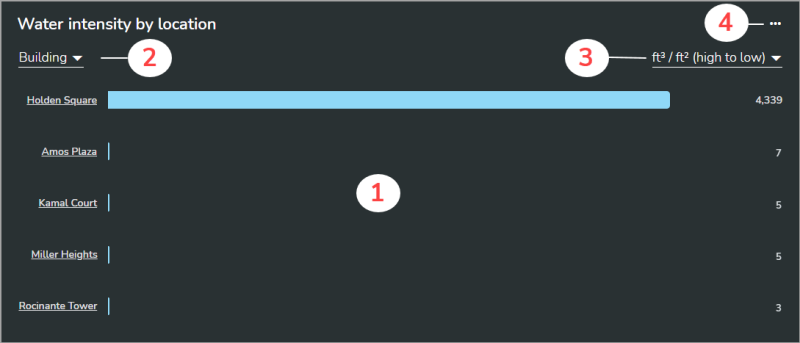
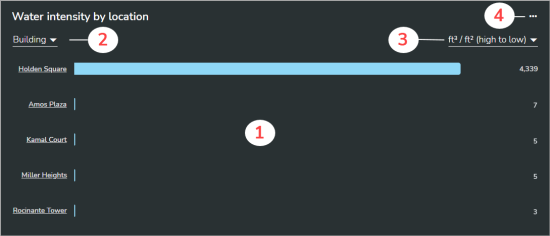
| 1 | Intensity by location | – | View water use intensity for the child locations of the location that you select in the organization tree. For example, if you select a building, you might want to see the water use intensity for all of its floors. |
| 2 | Child location selector | – | Select the type of child location for which you want to see water use intensity. The available options for child locations depend on the selected parent location and can include: Direct child location, Region, Site, Building, Floor, Area, Space, Production line, Zone, Devices. |
| 3 | Sort order selector | – | Select the order in which the child locations are ordered, high to low or low to high intensity. |
| 4 | Options menu | – | Select from available actions, for example 'Export data as CSV file'. |
For more information on Energy Code Compliance, see Energy Code Compliance.
This gadget shows fuel gas consumption trends and totals. The data is displayed as a vertical column chart. To set the date range for the displayed information, use the date range selector in the Views navigation bar, in Investigate.
Example (shown in dark mode):
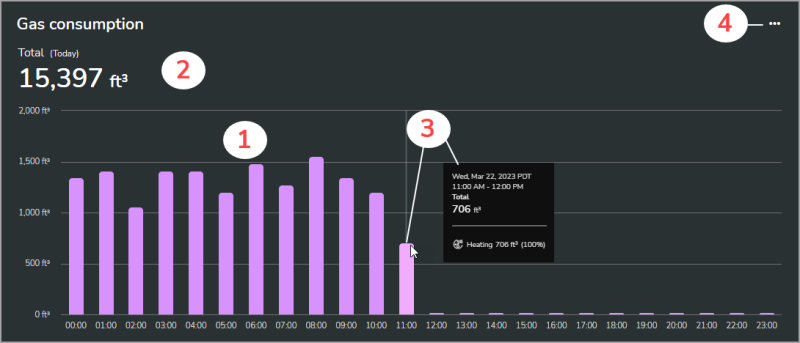

| 1 | Consumption trend | – | View the gas consumption trend for the selected location and date range. NOTE: The time range for a column in the chart includes the end point and excludes the starting point. For example, in an hourly column chart, a column labeled 08:00 includes measurements taken after 08:00 up to those taken at 09:00. |
| 2 | Consumption total | – | View the total gas consumption for the selected location and date range. |
| 3 | Consumption details | – | Hover the pointer over the total value or a consumption column to see details. |
| 4 | Options menu | – | Select from available actions, for example 'Export data as CSV file'. |
For more information on Energy Code Compliance, see Energy Code Compliance.
This gadget shows fuel gas cost trends and totals. The data is displayed as a vertical column chart. To set the date range for the displayed information, use the date range selector in the Views navigation bar, in Investigate.
Example (shown in dark mode):

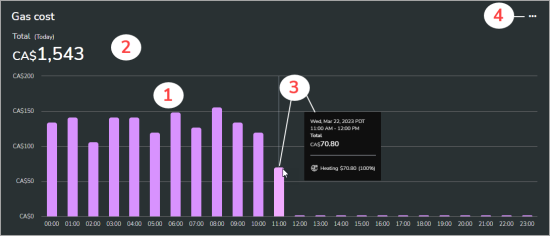
| 1 | Cost trend | – | View the gas consumption cost trend for the selected location and date range. NOTE: The time range for a column in the chart includes the end point and excludes the starting point. For example, in an hourly column chart, a column labeled 08:00 includes measurements taken after 08:00 up to those taken at 09:00. |
| 2 | Cost total | – | View the cost for the total gas consumption for the selected location and date range. |
| 3 | Cost details | – | Hover the pointer over the total value or a cost column to see details. |
| 4 | Options menu | – | Select from available actions, for example 'Export data as CSV file'. |
For more information on Energy Code Compliance, see Energy Code Compliance.