Electrical Distribution Monitoring and Alarming
NOTE: The functionality displayed in this topic might not be the same as what you see for your organization. Your Energy Hub feature plan subscription determines which functions and features are available for your organization. For feature plan details, see Feature plans.
| Overview |
| Functionality |
| Configuring EDMA |
| Viewing EDMA information |
Monitor the status of your electrical equipment and your energy infrastructure. Receive alarms and investigate exceptional operating conditions in your facility. Create single-line diagrams of your electrical system to see how system components are connected and to monitor the energy flow in the network. Monitor your electrical panels and switchboards to detect cable overheating.
The following describes the main concepts and functions in EDMA:
Energy Hub can display an electrical single-line diagram for a site. A single-line diagram shows a symbolic representation of your electrical power system. Use single-line diagrams to monitor your power system status and to show how the electrical components in your power system are connected. Different sites can have different single-line diagrams but you can only create one diagram per site.
IMPORTANT: The data shown in this display is not real-time data. The display shows the latest logged data for the equipment or monitoring device. Data updates can take up to 15 minutes.
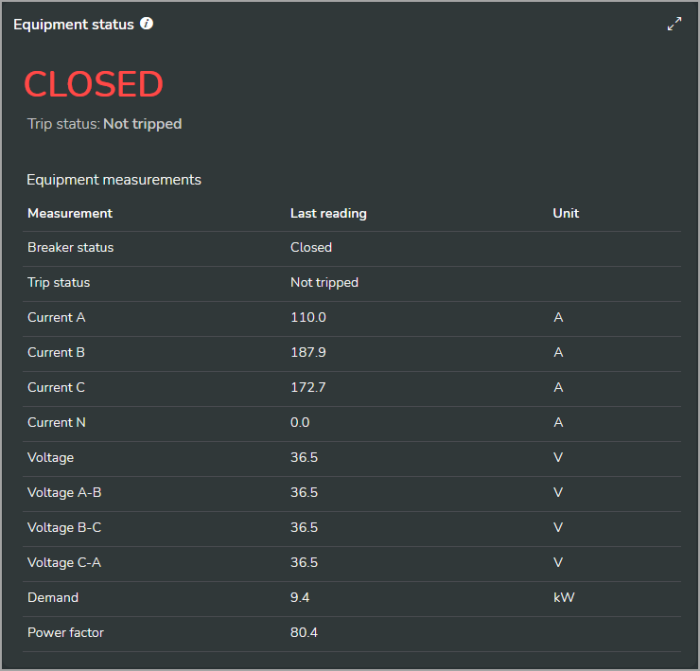
Energy Hub displays operational and status information for equipment and monitoring devices. You can view the latest measurement data, such as voltage, current, power factor, or circuit breaker status. The type of data that is available depends on the equipment or device that is being monitored.
IMPORTANT: The data shown in this display is not real-time data. The display shows the latest logged data for the equipment or monitoring device. Data updates can take up to 15 minutes.
Electrical Distribution Monitoring and Alarming includes the following alarm types:
Device-based alarms (generated by monitoring devices or communication gateways)
- Asset monitoring alarms (arc flash, backup power, over and under current, protection, thermal monitoring, ...)
- Power quality alarms (over- and under voltage, flicker, frequency, harmonics, interruptions, voltage disturbance, unbalance, ...)
- General alarms (general setpoints)
Software alarms (generated by Energy Hub)
Active power alarm
| Property | Value / Description |
|---|---|
|
Category |
Power Quality |
|
Type |
Software alarm |
|
Measurement |
Active power (phase total) |
|
Application |
Equipment, circuit breakers, electrical devices, power meters, energy meters |
|
Direction (configurable) |
Over active power |
|
Priority (configurable) |
High, medium, or low |
|
Sampling interval |
This alarm uses logged data. |
|
Trigger |
Over active power
Under active power
|
|
Configurable |
Yes |
|
Notification can be turned off |
Yes |
For more information on alarms in Energy Hub and how to set up software alarms, see Alarming.
Current alarm
| Property | Value / Description |
|---|---|
|
Category |
Power Quality |
|
Type |
Software alarm |
|
Measurement |
Current (phase average) |
|
Application |
Equipment, electrical devices, power meters, branch circuit monitors |
|
Direction (configurable) |
Over current |
|
Priority (configurable) |
High, medium, or low |
|
Sampling interval |
This alarm uses logged data. |
|
Trigger |
Over current
Under active power
|
|
Configurable |
Yes |
|
Notification can be turned off |
Yes |
For more information on alarms in Energy Hub and how to set up software alarms, see Alarming.
Voltage alarm
| Property | Value / Description |
|---|---|
|
Category |
Power Quality |
|
Type |
Software alarm |
|
Measurement (configurable) |
Voltage line-to-line (phase average) or |
|
Application |
Equipment, electrical devices, power meters, branch circuit monitors |
|
Direction (configurable) |
Over voltage |
|
Priority (configurable) |
High, medium, or low |
|
Sampling interval |
This alarm uses logged data. |
|
Trigger |
Over voltage
Under voltage
|
|
Configurable |
Yes |
|
Notification can be turned off |
Yes |
For more information on alarms in Energy Hub and how to set up software alarms, see Alarming.
Power factor alarm
| Property | Value / Description |
|---|---|
|
Category |
Power Quality |
|
Type |
Software alarm |
|
Measurement |
Power factor (unsigned, phase average) |
|
Application |
Equipment, electrical devices, power meters |
|
Direction |
Under power factor |
|
Priority (configurable) |
High, medium, or low |
|
Sampling interval |
This alarm uses logged data. |
|
Trigger |
Under power factor
NOTE: Depending on the monitoring device, the power factor used for this alarm is a positive number between 0–1 or 0–100. To determine which format to use, check the power factor measurements for the device in Trends in Asset view. |
|
Configurable |
Yes |
|
Notification can be turned off |
Yes |
For more information on alarms in Energy Hub and how to set up software alarms, see Alarming.
Cable overheating detection
Use Energy Hub and PowerLogic™ HeatTag™ wireless sensors for early detection of overheating cables in low-voltage (LV) equipment, such as switchboards or panelboards.
Overheating cables can cause equipment damage and fires. HeatTag sensors that are installed in the equipment can detect gases and particles that are released when cables are overheating. When the gas and particle concentration reach a certain limit, the HeatTag sensors generate alarms that are displayed in Energy Hub. Energy Hub can also send email notifications and mobile push notifications for these alarms.
HeatTag alarms:
Asset monitoring alarms
HeatTag devices generate a Thermal / temperature alarm when detecting cable overheating conditions. The priority of this alarm increases as the gas and particle concentration increases:
- Low priority Thermal / temperature alarm (cables are beginning to overheat and maintenance actions should be planned).
- Medium priority Thermal / temperature alarm (cables are overheating; timely action is required).
- High priority Thermal / temperature alarm (cables are overheating fast; immediate action is required).
Diagnostics alarms
HeatTag devices generate two types of diagnostics alarms:
- High priority Device replacement alarm (HeatTag sensor is out of service).
- High priority Fan error alarm (HeatTag fan needs cleaning).
Energy Hub notifications:
Energy Hub sends three types of notifications:
- Notification when a HeatTag alarm goes active or inactive.
- (*) Notification if HeatTag alarms have been active for more than two weeks. This notification is sent every two weeks until the alarms are no longer active.
- (*) Notification if no alarms have been generated by HeatTag devices for a site in the previous three months.
(*) These notifications are not controlled by the notification settings in Energy Hub and cannot be disabled.
Overheating of cables can take days, weeks, or months until enough gas and particles are produced to trigger an alarm. However, continuous monitoring is important, which means you need a reliable communication network that connects the HeatTag sensors to the communication gateway and the gateway to Energy Hub.
NOTE: Energy Hub assigns a Low alarm priority to device-based communication loss alarms. Do not ignore these alarms for devices that are related to cable overheating detection monitoring.
NOTE: You do not receive HeatTag alarms and Energy Hub notifications during a communication interruption between the HeatTag sensors, communication gateways, Energy Hub, and your email or mobile device.
Energy Hub includes a gateway communication loss software alarm that monitors the communication link between Energy Hub and the communication gateways. This alarm can notify you of communication issues. See general alarms to review the details of this alarm and to understand its behavior and limitations.
For detailed information on PowerLogic HeatTag sensors, see the HeatTag user guide (download page) and other product information available on the Schneider Electric website.
For information on the technology used by HeatTag sensors for detecting cable overheating, see [white paper]: New gas and particle sensing technology detects cables overheating in LV equipment (download page).
The following lists prerequisites and configuration tasks for setting up EDMA:
Before configuring EDMA, verify that:
- You have a subscription to a feature plan that includes EDMA.
- Power monitoring devices are installed in your facility to monitor loads such as lighting, air conditioning, plug loads, and other consumers.
- The monitoring devices are connected to communication gateways, for example Site Server or Panel Server, that are sending measurement data to Energy Hub over the internet.
- The communication gateways have been added to your organization in Energy Hub.
To configure the base functionality for EDMA:
- No configuration is required to see equipment status information.
- No configuration is required to receive EDMA alarms and notifications.
- (Optional) Create single-line diagrams for your sites.
- (Optional) Customize your notification settings.
To create a single-line diagram:
- In Energy Hub, go to Setup > System setup.
- In the organization diagram in the configuration panel, find the site that you want to create a single-line diagram for and select Configure site. The Configure site screen displays.
NOTE: If there are no sites defined yet in the organization diagram, then add sites first. See Adding regions and sites for details.
- In Configure site, select Electrical view.
- To add the first diagram element, in the Electrical screen, right-click anywhere and select Add diagram element. The Add diagram element dialog displays.
TIP: A single-line diagram element represents an electrical component, for example, a transformer, circuit breaker, or electrical bus.
- In Add diagram element, enter the following information:
Element name: The display name for the element in the diagram. Type: The type of electrical component the function represents Monitoring device: The device providing the monitoring data for the electrical component. Upstream monitoring device: (Optional) A device monitoring the input circuit of the electrical component. Downstream monitoring device: (Optional) A device monitoring the output circuit of the electrical component. - (Optional) To add additional individual elements to the diagram that are not connected to each other, repeat steps 4 and 5.
- To add an element that is connected to an existing element, for example, to add a circuit breaker to an existing transformer:
- Right-click the existing element and select Add upstream element or Add downstream element depending on where you want to connect the new element. The add element dialog displays.
- In the add element dialog, enter the information to define the element.
- (Optional) To add additional connected elements, repeat step 7.
To edit a single-line diagram:
NOTE: Viewer users cannot perform this task.
- In Energy Hub, go to Setup > System setup.
- In the organization diagram in the configuration panel, find the site you want to edit the single-line diagram for and select Configure site. The Configure site screen displays.
- In Configure site, select Electrical view. The single-line diagram displays.
- (Optional) Right-click an existing diagram element and select an option to edit it, add upstream or downstream elements, or remove it from the diagram.
- (Optional) Right-click anywhere in the Electrical screen and select Add diagram element to add an additional individual element that is not connected to an existing element.
- (Optional) Repeat steps 4 and 5 to make your diagram edits.
To select a symbol standard for a single-line diagram:
- In Energy Hub, go to Investigate and select the Asset view, Energy view, or Electrical view.
- In the navigation panel, find and select the site that you want to select the single-line diagram symbols for.
- In the information panel for the site, on the Info tab, from the options menu (three dots), select Edit to open the information panel editor.
- In the information panel editor, under Information, find the SLD symbol standard box and select the standard (IEC or NEMA) that you would like to use for this site.
- Select Save.
TIP: You can also set the symbol standard in Setup > System setup, in the information panel for the site.
To edit notification settings:
- In Energy Hub, go to Setup > Notification settings.
- In the configuration panel, customize the available settings to meet your needs.
Prerequisites
In addition to the base functionality prerequisites for EDMA, the following is required for cable overheating detection:
- HeatTag monitoring devices are installed in the relevant locations in your facility and are connected to communication gateways.
Configuration
No configuration is required for cable overheating detection.
The following shows how you can view EDMA information in Energy Hub:
NOTE: Always consider the Safety Precautions when using information provided by Energy Hub for decision making.
Before you can view EDMA information you need to configure EDMA.
- In Energy Hub, go to Investigate and select the Asset view.
- In the organization tree, select the asset or monitoring device that you want to see the information for.
- In the display panel, view equipment status in the Equipment status display.
TIP: To set the date range for the displayed information, use the date range selector in the Views navigation bar, in Investigate.
NOTE: Not all equipment and devices provide status information.
- In Energy Hub, go to Investigate and select the Asset view.
- In the organization tree, select the equipment or monitoring device that you want to see the data trends for.
- In the display panel, view the data trends in the Trends display.
TIP: To set the date range for the displayed information, use the date range selector in the Views navigation bar, in Investigate.
NOTE: The type of data that is available depends on the type of equipment and monitoring device that are providing the data.
- To view alarm information for your entire organization, go to Inbox.
- To view alarm information for a site:
- Go to Investigate and select the Electrical view or the Asset view.
- In the organization tree, select the site that you want to see the information for.
- In the display panel, view the alarm information.
- To view alarm information for a location, for example a building:
- Go to Investigate and select the Asset view.
- In the organization tree, select the location that you want to see the information for.
- In the display panel, view the alarm information.
- To view alarm information for an asset or a monitoring device:
- Go to Investigate and select the Asset view.
- In the organization tree, select the asset or monitoring device that you want to see the information for.
- In the display panel, view the alarm information.
TIP: To set the date range for the displayed information, use the date range selector in the Views navigation bar, in Investigate.
- In Energy Hub, go to Investigate and select the Electrical view.
- In the navigation panel, find and select the site that you want to view the single-line diagram for. Site specific information displays in the main display panel.
- If the single-line diagram does not already display, use the drawer control
 at the top of the display panel to open the single-line diagram.
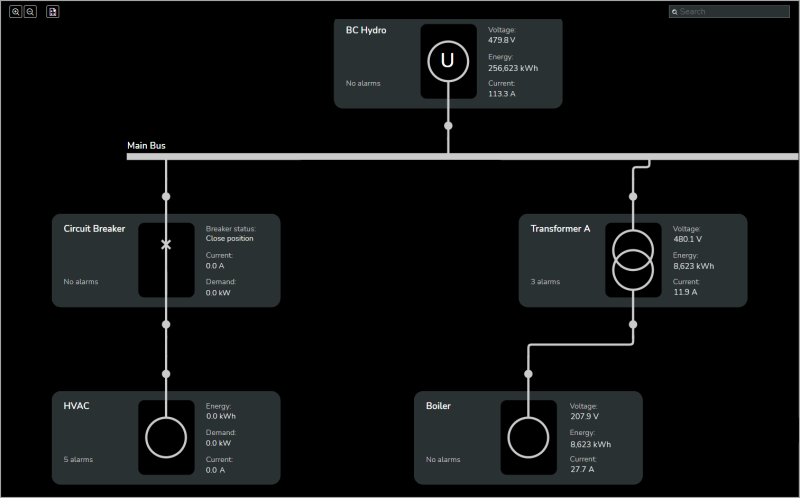
This display shows an electrical single-line diagram.
TIP: Hover the pointer over the display to see related information.
IMPORTANT: The data shown in this display is not real-time data. The display shows the latest logged data for the equipment or monitoring device. Data updates can take up to 15 minutes.
Examples (shown in dark mode and in English language):
Diagram zoomed out
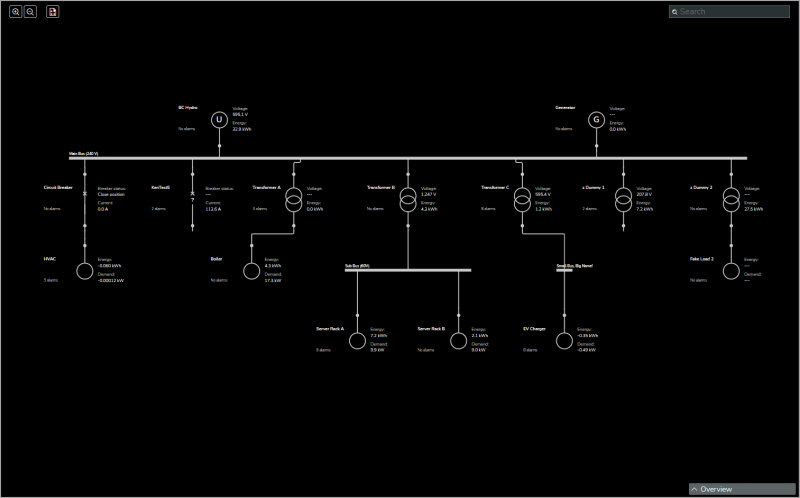
Diagram zoomed in
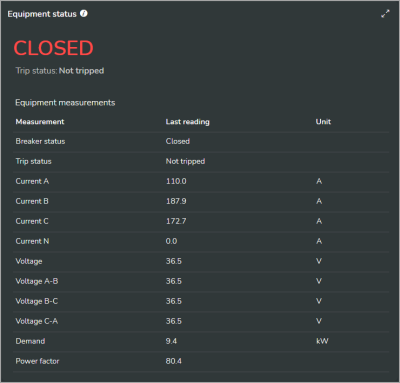
This display shows power system data for the selected equipment or monitoring device. The type of equipment and monitoring device that are providing the data determines which data is available.
TIP: Select the arrows icon in the top right corner to maximize the display.
IMPORTANT: The data shown in this display is not real-time data. The display shows the latest logged data for the equipment or monitoring device. Data updates can take up to 15 minutes.
Example (shown in dark mode and in English language):
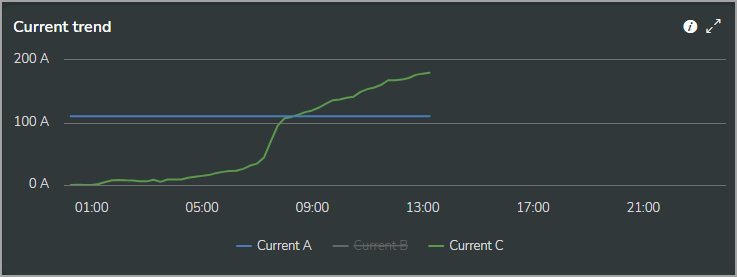
This display shows power system data trends for common measurements, such as voltage, current, power factor, demand, power, energy, frequency, THDi, and THDv. The type of equipment and monitoring device that is providing the data determines which data is available.
- To hide or show a series in the chart, select it in the chart legend.
- Hover the pointer over the display to see related information.
- Hover over the i-icon to see the specific measurements that are used.
- Drag the pointer over the chart to zoom.
- Select the arrows icon in the top right corner to maximize the display.
IMPORTANT: The data shown in this display is not real-time data. The display shows the latest logged data for the equipment or monitoring device. Data updates can take up to 15 minutes.
Examples (shown in dark mode and in English language):
Current trend for three phase currents
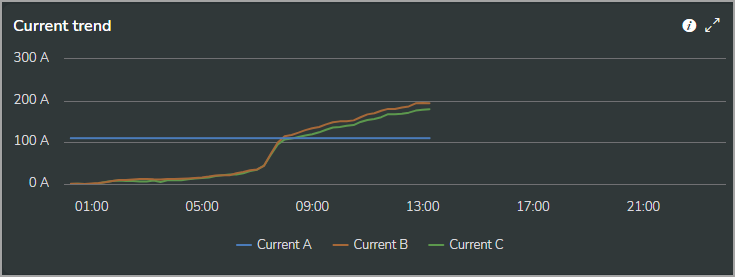
Current trend with current on phase B hidden
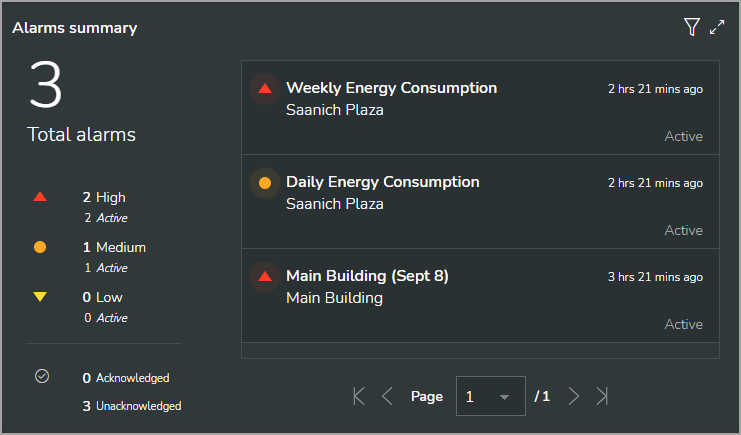
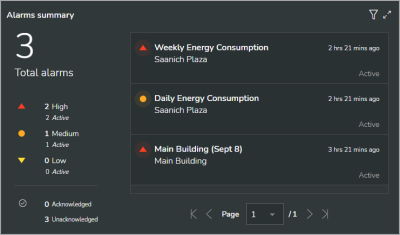
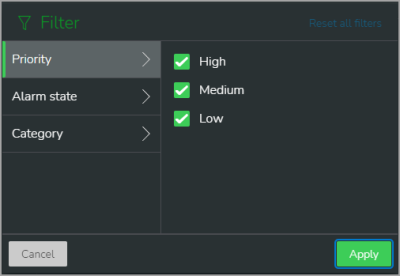
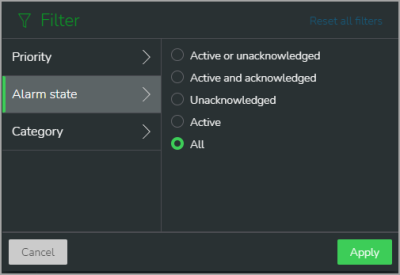
This display shows alarms for the location, equipment, or device selected in the organization tree. The alarm information includes an alarms list, alarm counts and alarm status. Select an alarm from the list to see alarm details. Use the alarms filter (funnel icon) to filter the list based on alarm priority, alarm state, or alarm category.
TIP: Select the arrows icon in the top right corner to maximize the display.
Examples (shown in dark mode and in English language):
Alarms summary
Alarm details
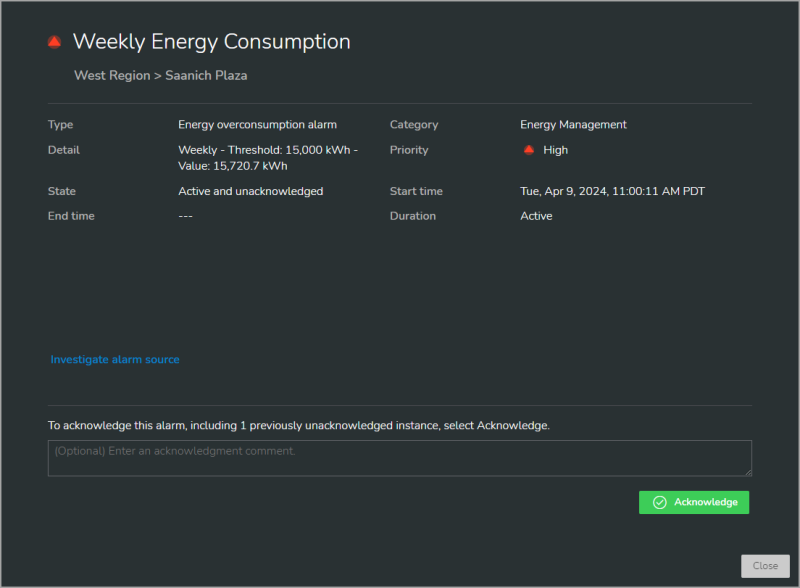
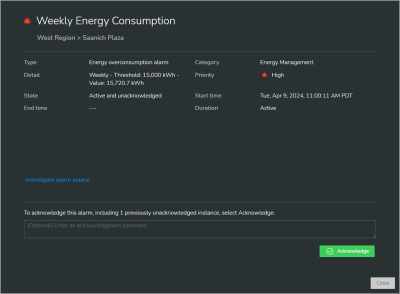
Details for the alarm selected from the alarm list. Select the investigate alarm source link in the details display to open the location, equipment, or device that generated the alarm. Select Acknowledge, to acknowledge the alarm and enter an optional comment.
Alarm list filter
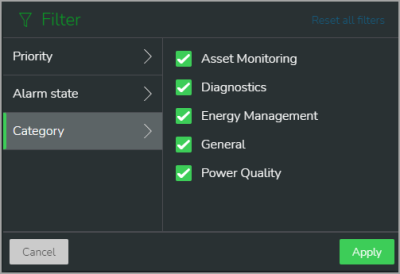
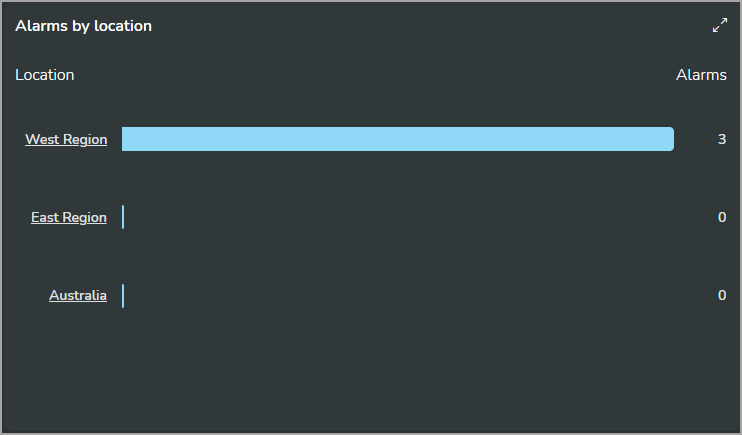
This display shows the number of alarms for the child locations of the selected location. The chart is ordered by alarm count, with the highest alarm count at the top.
NOTE: This display shows a maximum of 10 locations.
TIP: Select the arrows icon in the top right corner to maximize the display.
Example (shown in dark mode and in English language):
You can view cable overheating detection alarms in Inbox and in Investigate > Asset view.
 warning