Functions and user interfaces (UIs)
Energy Hub is an energy information system. It aggregates and analyzes energy system data from monitoring devices in your facility. You can access Energy Hub with a web application on your personal computer or with a mobile app on your mobile device. For detailed information on how to access Energy Hub, see Energy Hub access.
NOTE: The functionality displayed in this topic might not be the same as what you see for your organization. Your Energy Hub feature plan subscription determines which functions and features are available for your organization. For feature plan details, see Feature plans.
The following is a high-level tour of the main functions and user interfaces of Energy Hub:
The following shows a main application window example (shown in dark mode):

The main application window has the following components:
The application header contains an options menu with "About" information, Schneider Electric and Energy Hub logos, an organization selector, a user selector, and a link to the Energy Hub support center.
The following shows an application header example (shown in dark mode):


The main navigation bar shows the Energy Hub functions and features you can access. The following options exist: Home, Inbox, Investigate, Tenant Billing, NABERS, Setup.
NOTE: The NABERS rating functionality in Energy Hub is only available to users in Australia.
The following shows a navigation bar example:

The content panel displays context specific data and information for Energy Hub features.
The following shows a content panel example (shown in dark mode):

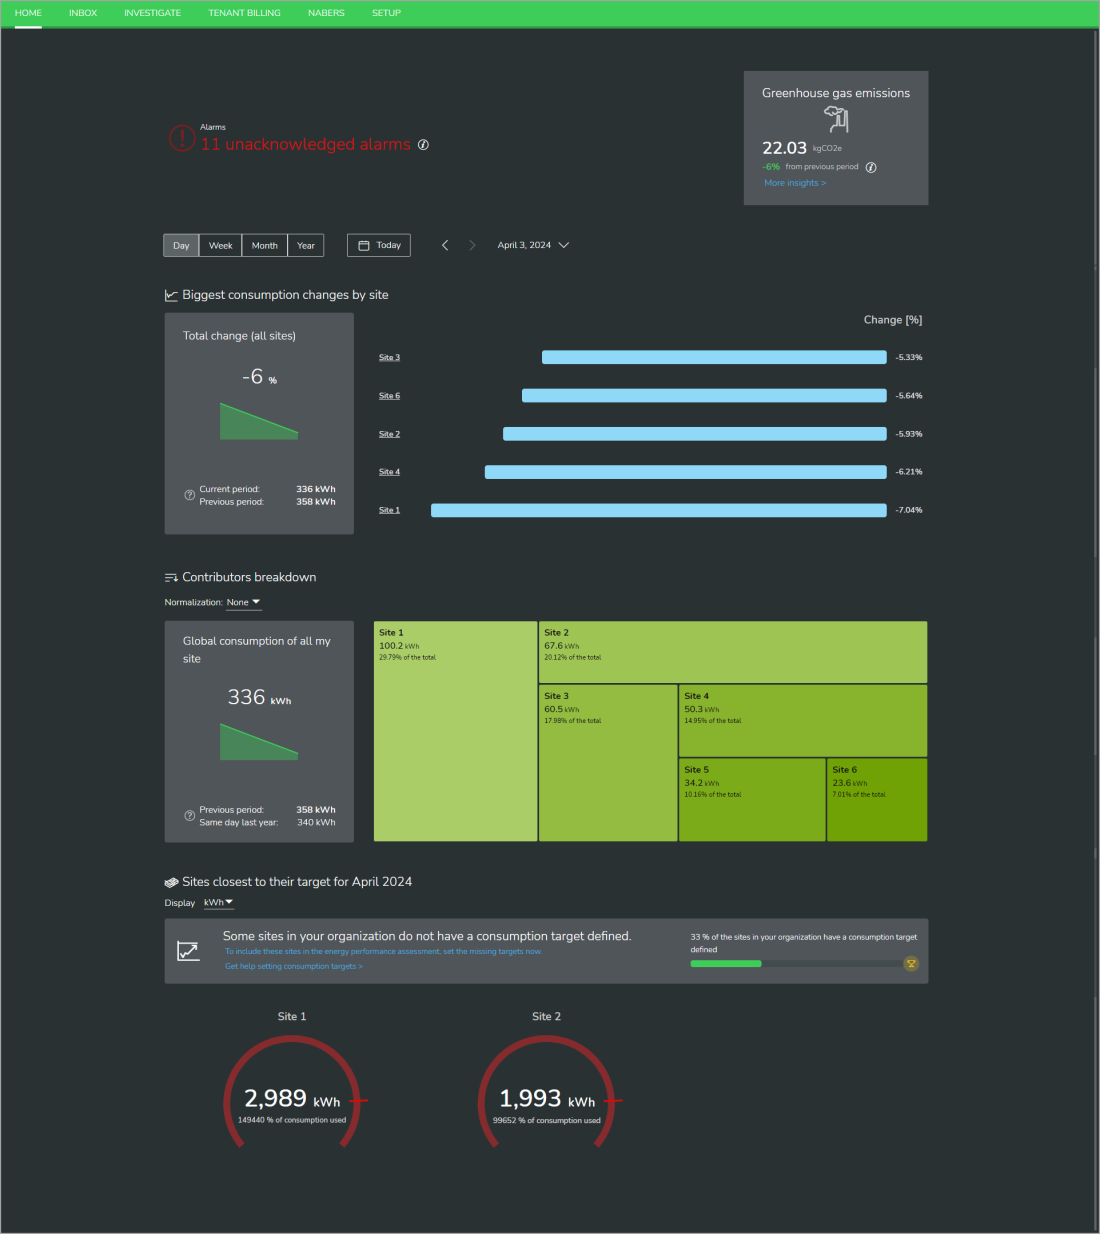
Home displays high-level summary information about the energy performance of your organization.
The following shows a Home example (shown in dark mode):

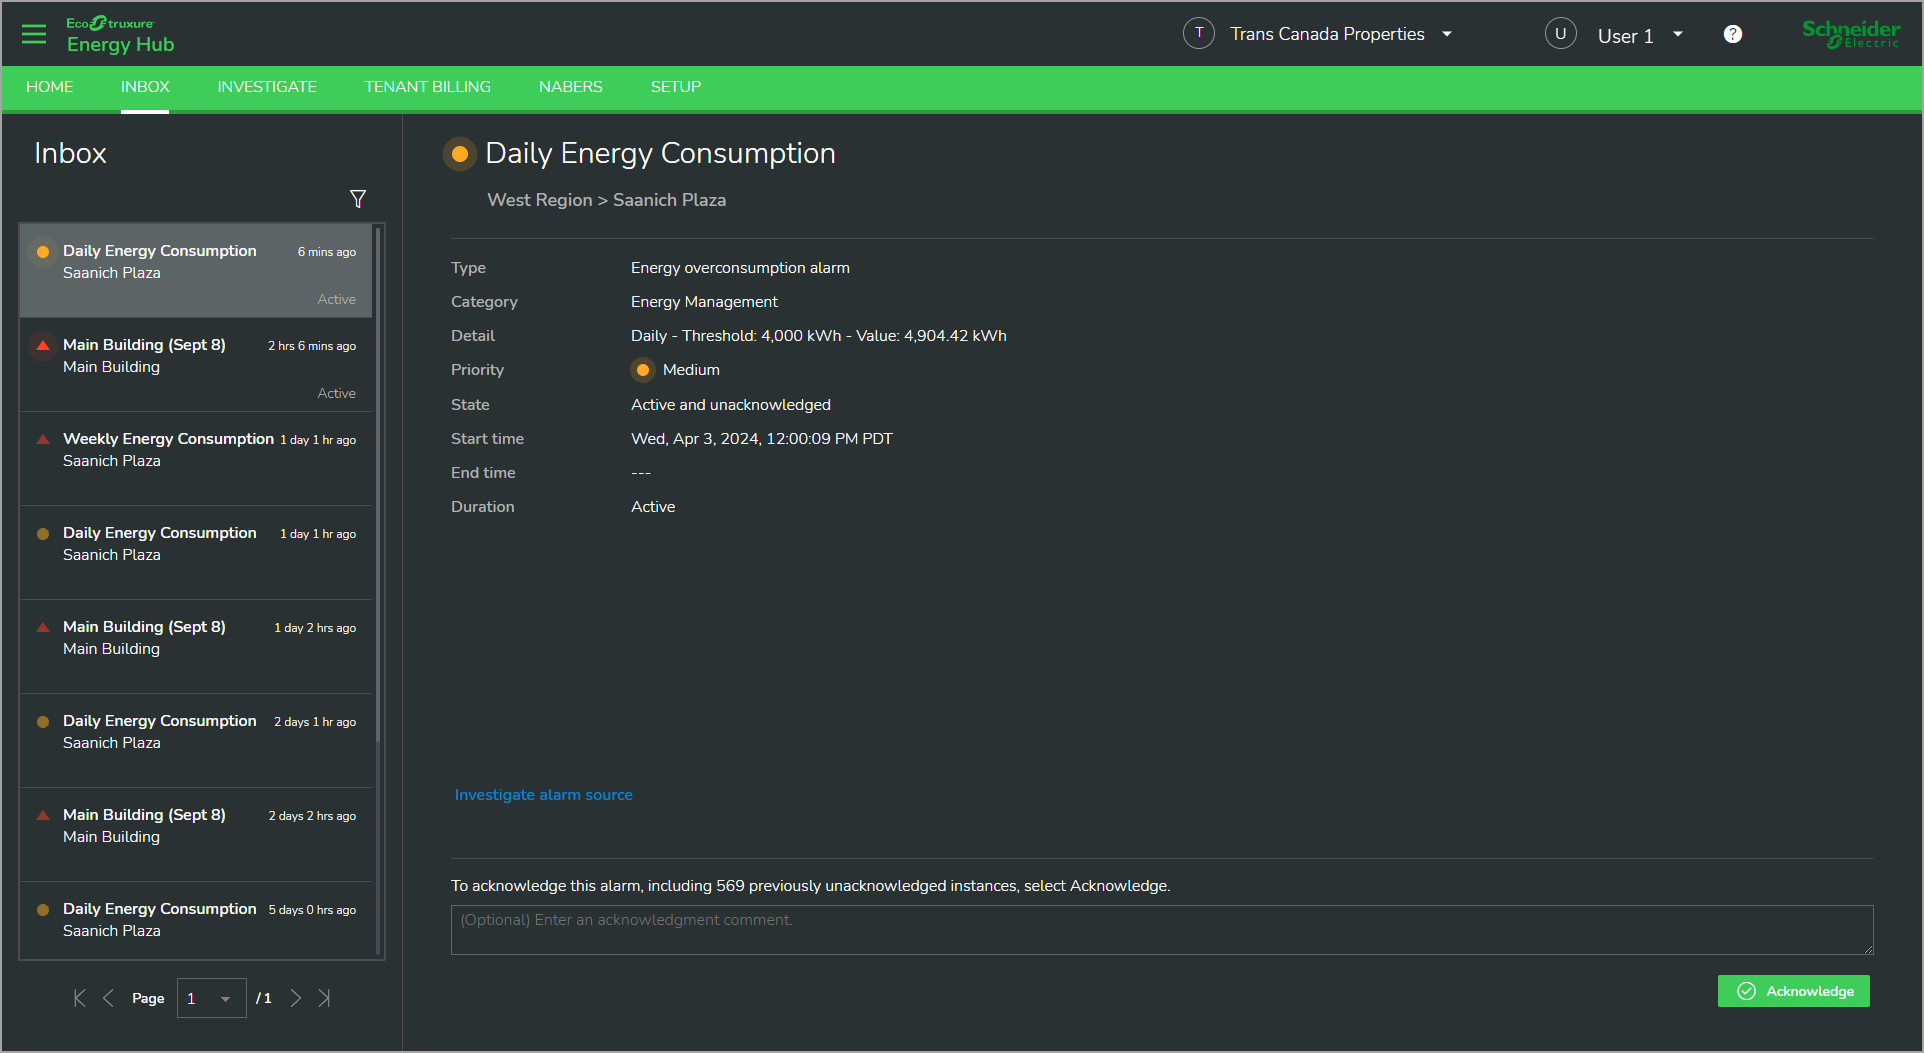
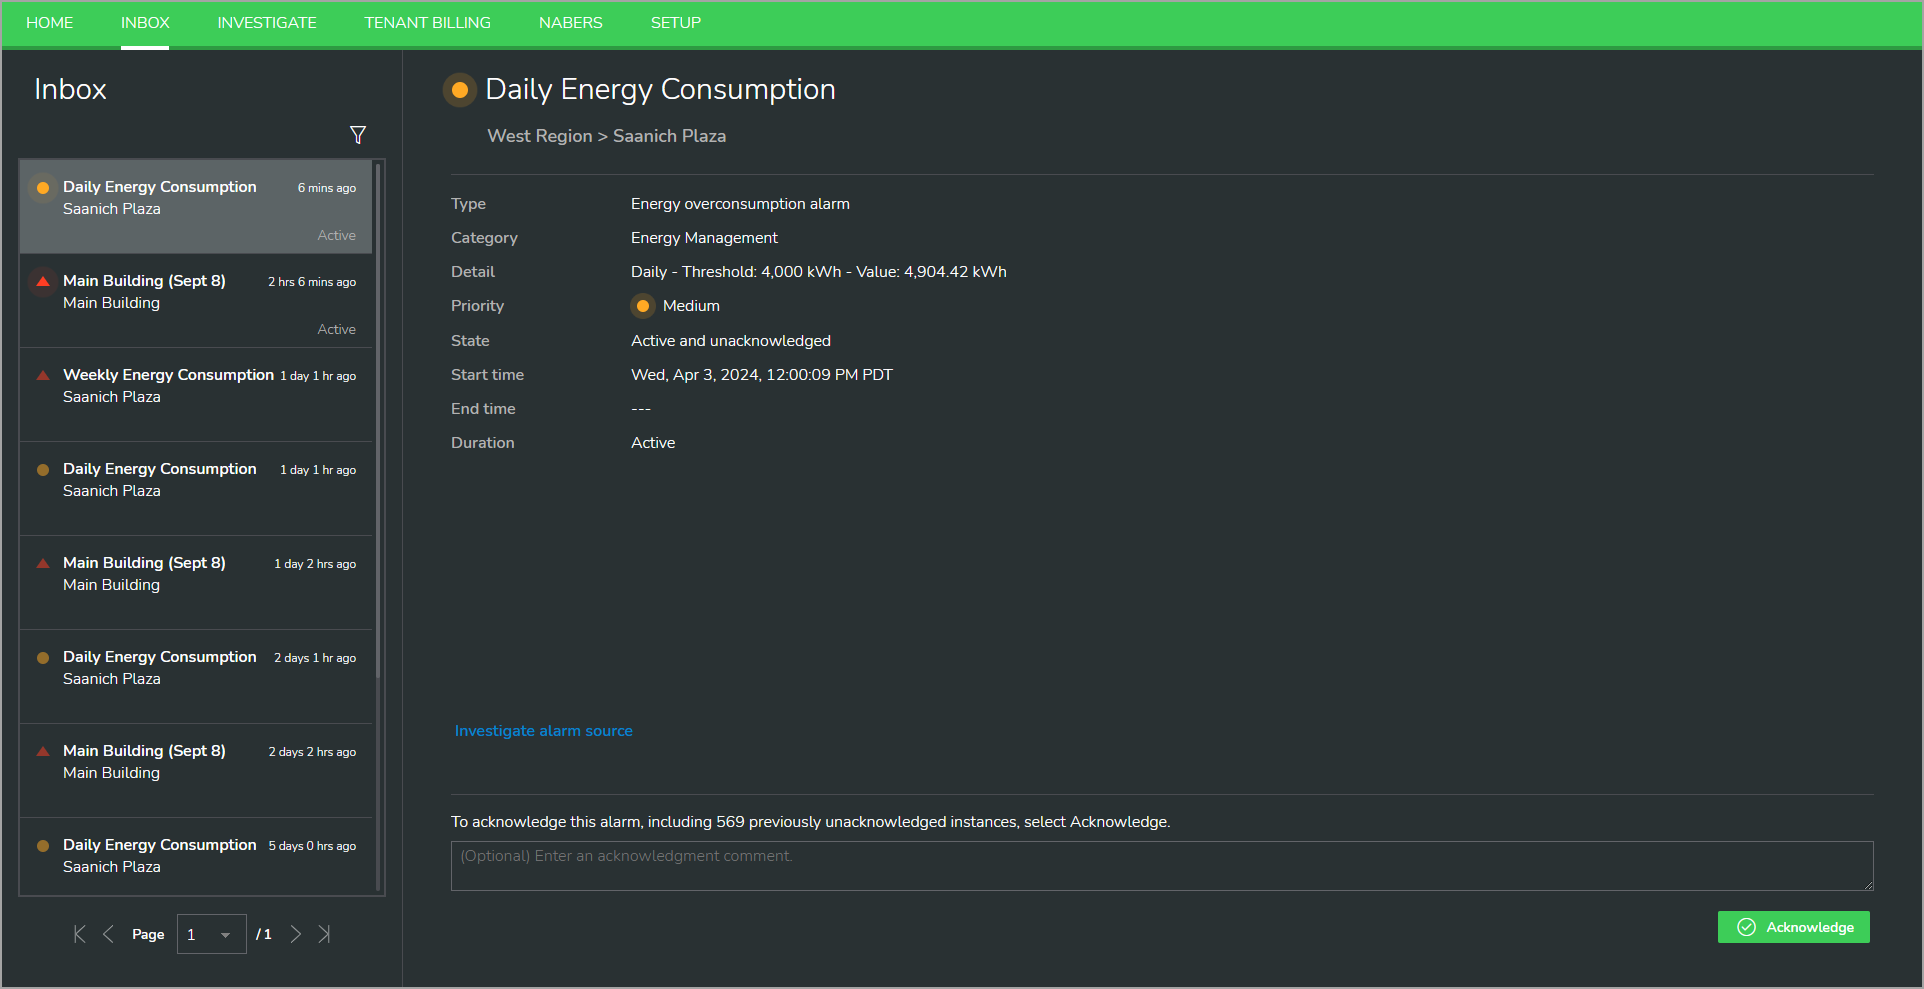
Inbox displays alarm information for the entire organization based on the user's notification settings. It features a navigation panel on the left for viewing and selecting alarms, and a display panel on the right to show details for the selected alarm.
The following shows an Inbox example (shown in dark mode):

Investigate displays energy system data and information. The Investigate UI includes a toolbar with controls, a navigation panel on the left for selecting a location or equipment, a display panel in the center to show the data, and an information panel on the right with details for the selected location or equipment.
The following shows an Investigate example (shown in dark mode):
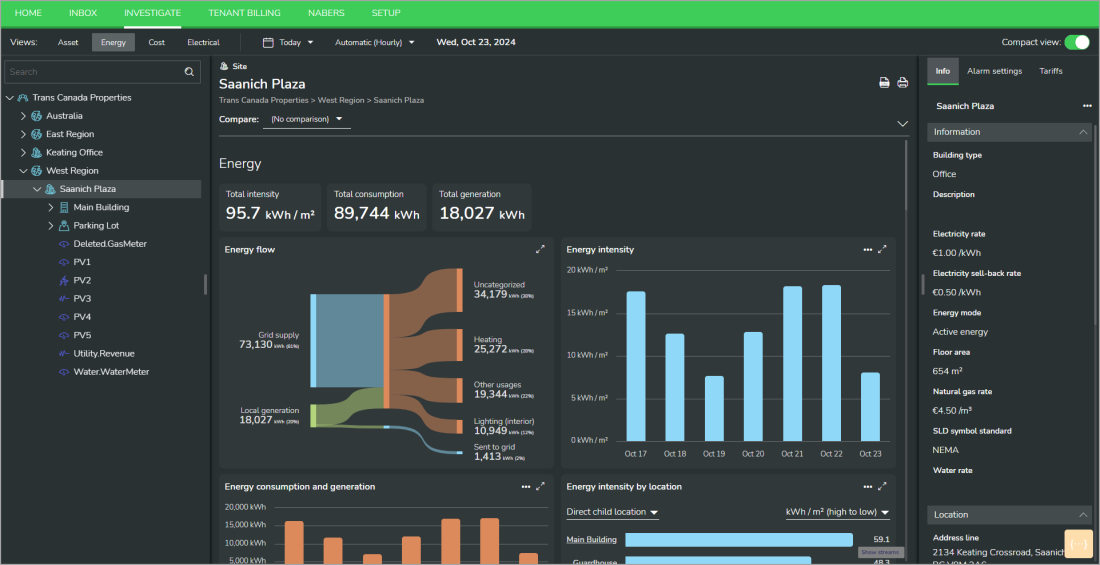

Investigate has the following components:
The toolbar includes a view selector, a date range selector, an aggregation interval selector, and a display type control.
NOTE: Some of the toolbar controls are only available in certain information views.
The following shows a toolbar example (shown in dark mode):


- The view selector sets the information view that is displayed. For details on information views, see Information views.
- The date range selector sets the time range for the displayed energy system data. For details on the date range selector, see Date range selector
- The aggregation interval selector sets the aggregation interval for the energy data, for example, hourly or daily. For details on the aggregation selector, see Aggregation selector
- The display type control switches between an expanded and a compact view of the data displays on the page.
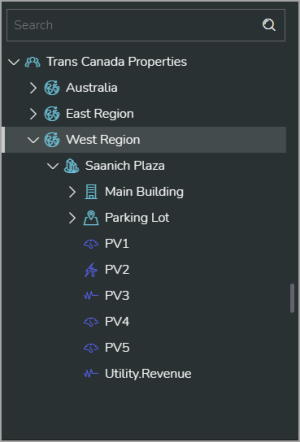
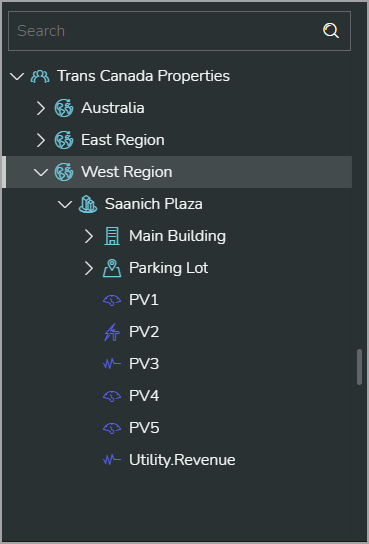
The navigation panel shows the organization tree with its locations, equipment, and monitoring devices. Selecting an item in the organization tree displays its information in the display panel and the information panel.
The following shows a navigation panel example (shown in dark mode):
The display panel shows energy system data based on the information view selected in the view selector. The following views exist: Asset, Energy, Cost, Electrical.
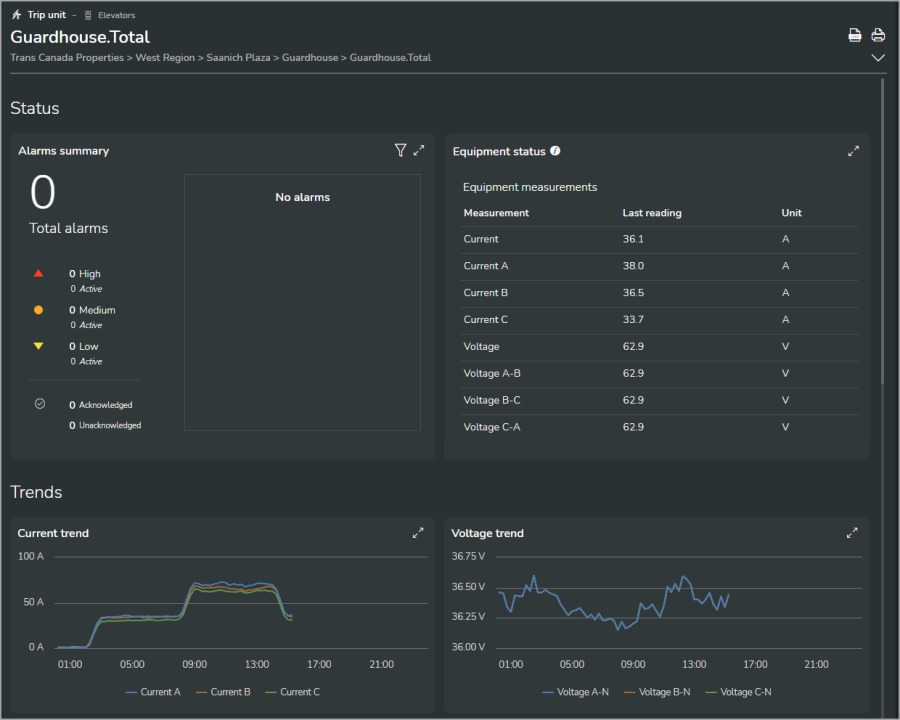
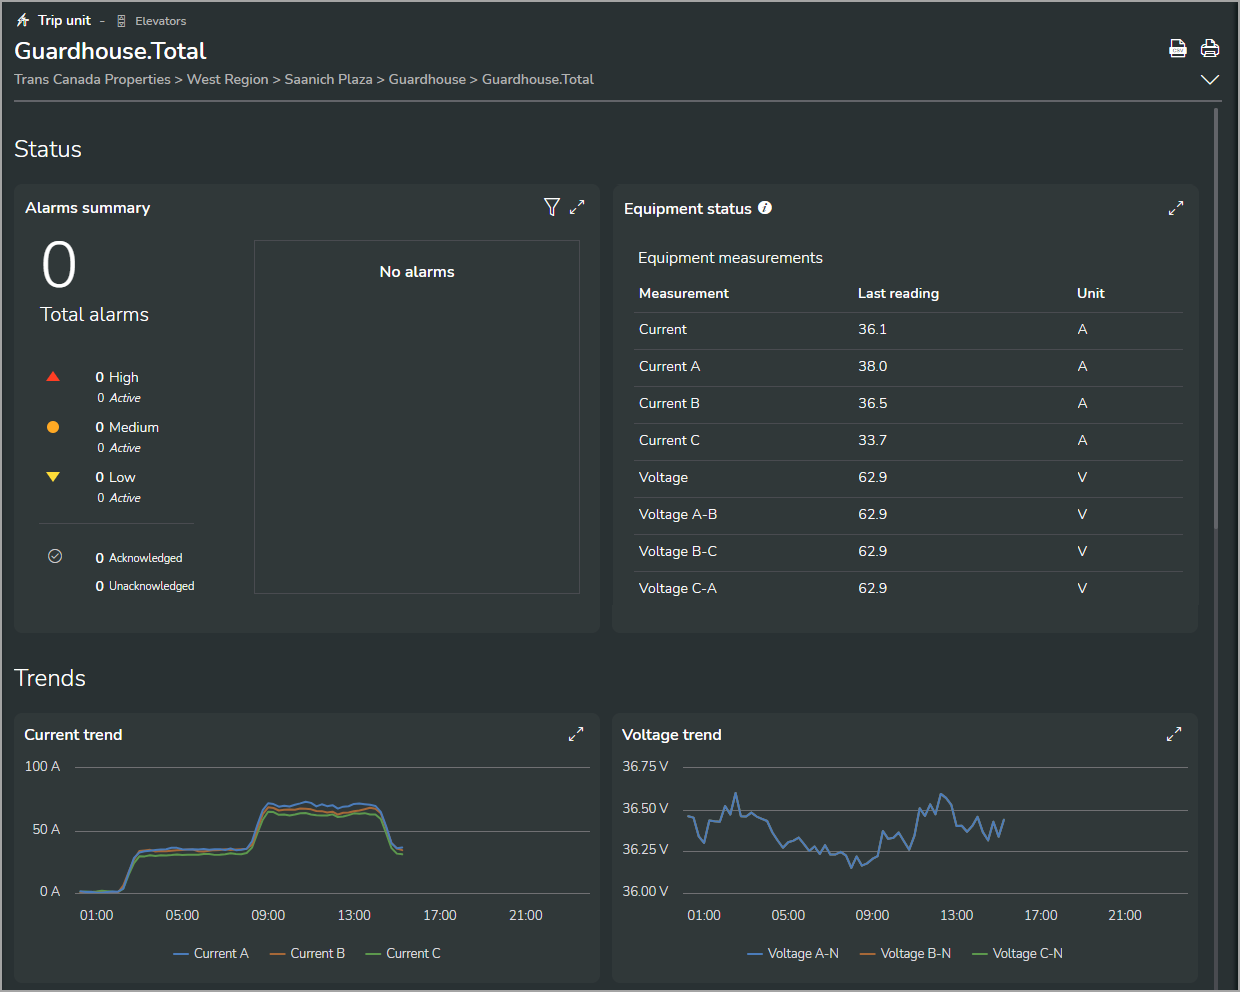
The Asset view shows equipment (asset) related data, such as alarms, equipment status, and electrical data trends for the item selected in the navigation panel. The type of data that is displayed depends on the selected item. For information on which data is available for locations, equipment, and monitoring devices, see Data displays.
The following shows an Asset view example (shown in dark mode):
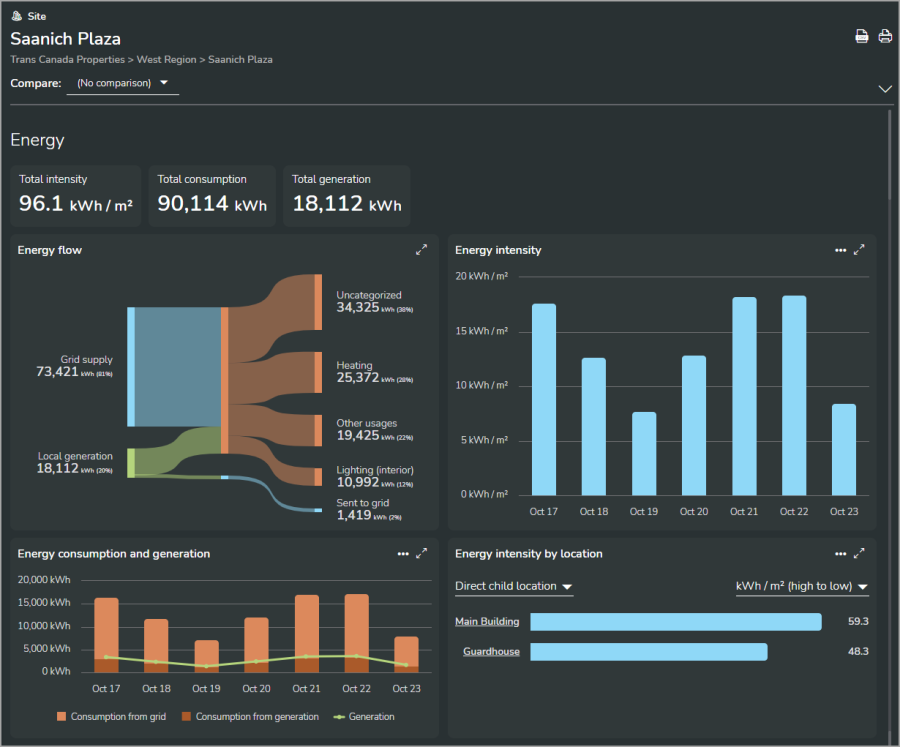
The Energy view shows energy consumption and production, power demand, water and gas consumption, and advanced analysis, such as consumption normalized by degree days for the item selected in the navigation panel. The type of data that is displayed depends on the selected item. For information on which data is available for locations, equipment, and monitoring devices, see Data displays.
The following shows an Energy view example (shown in dark mode):

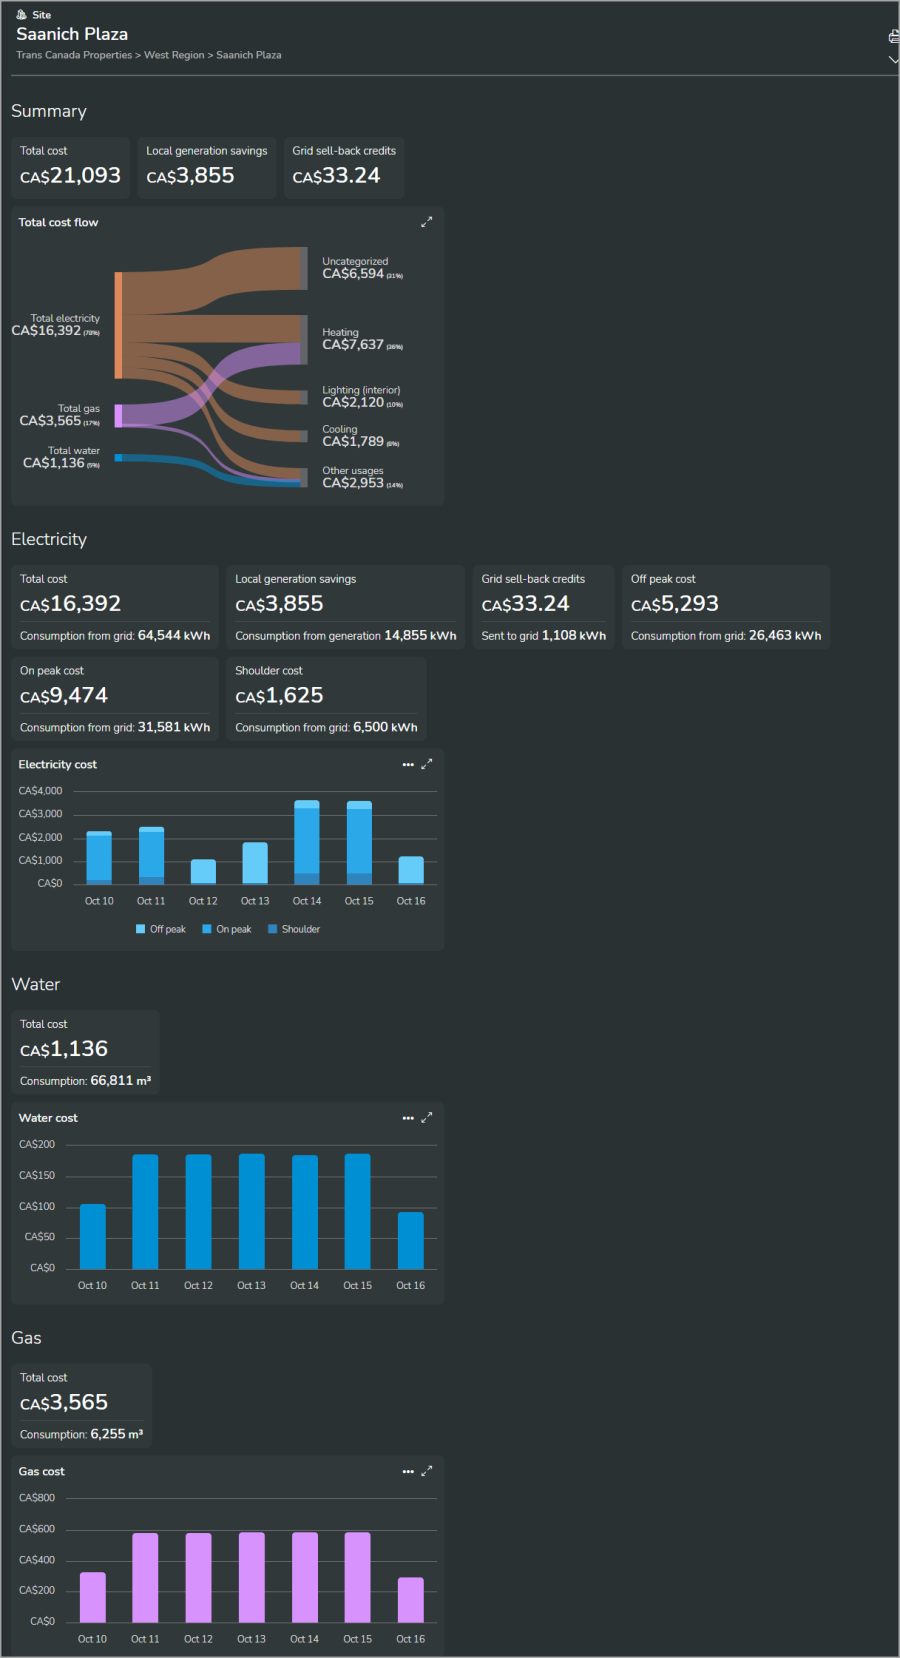
The Cost view shows the financial impact of commodity and energy consumption and production for the item selected in the navigation panel.
The following shows a Cost view example (shown in dark mode):

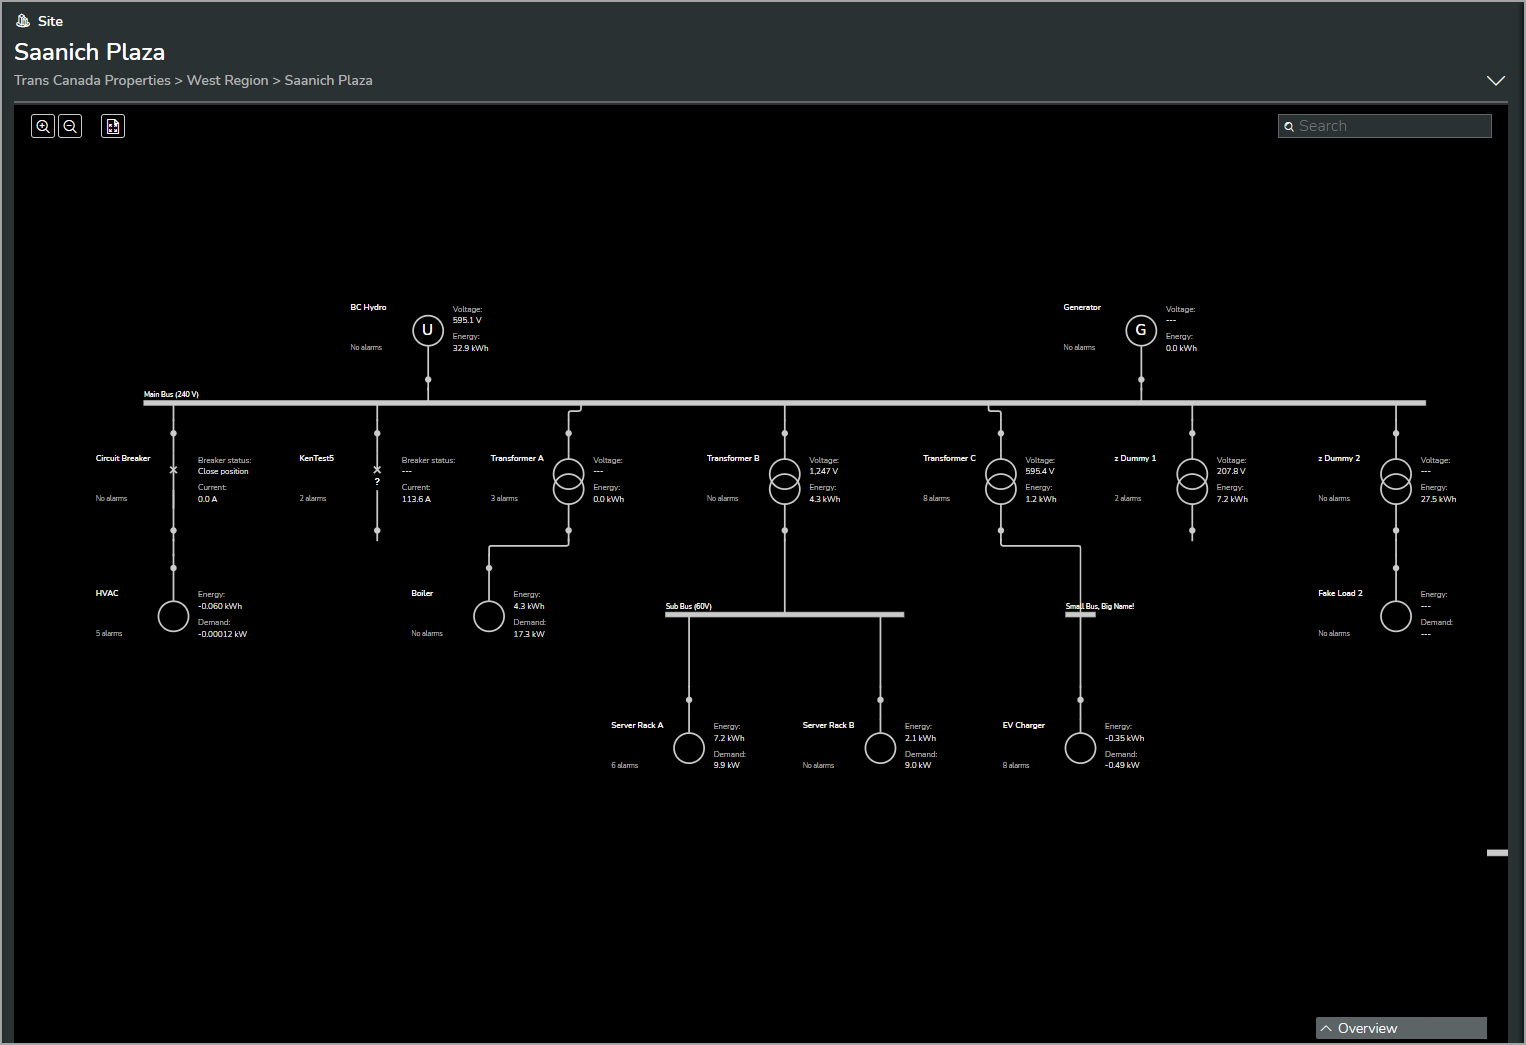
The Electrical view shows electrical single-line diagrams for the sites in your organization.
The following shows an Electrical view example (shown in dark mode):

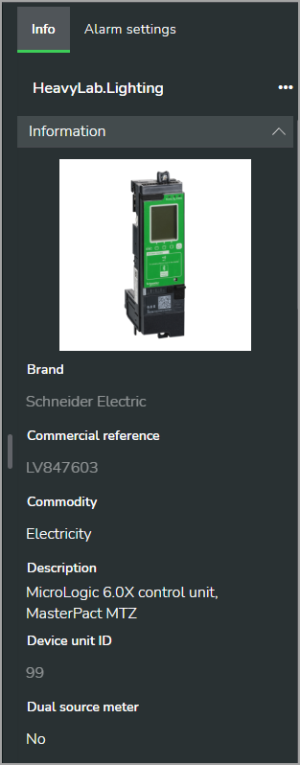
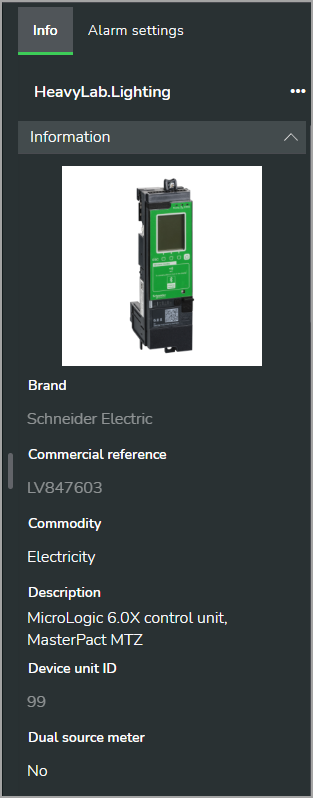
The information panel shows meta data related to the item selected in the organization tree, such as settings, descriptions, or address information.
The following shows an information panel example (shown in dark mode):
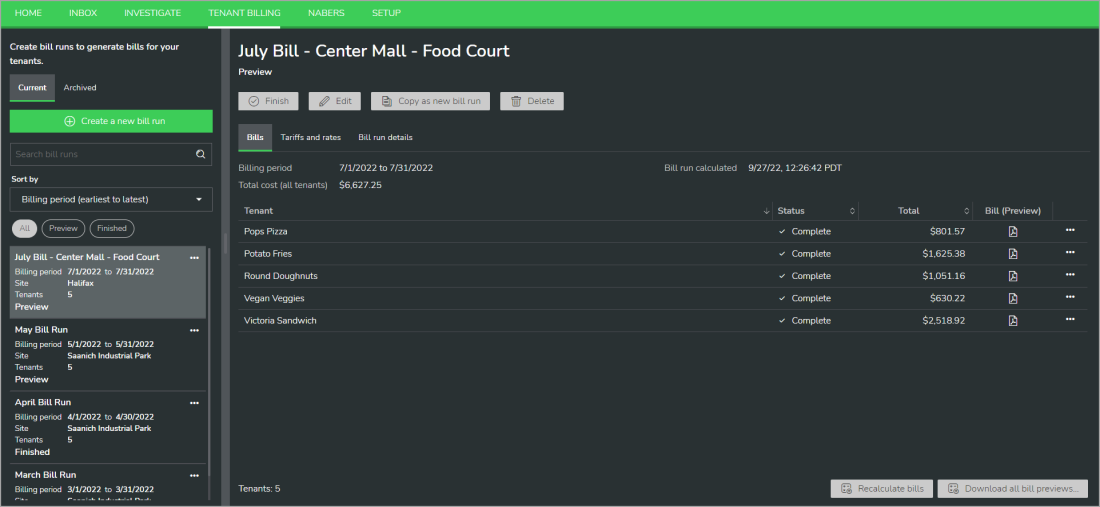
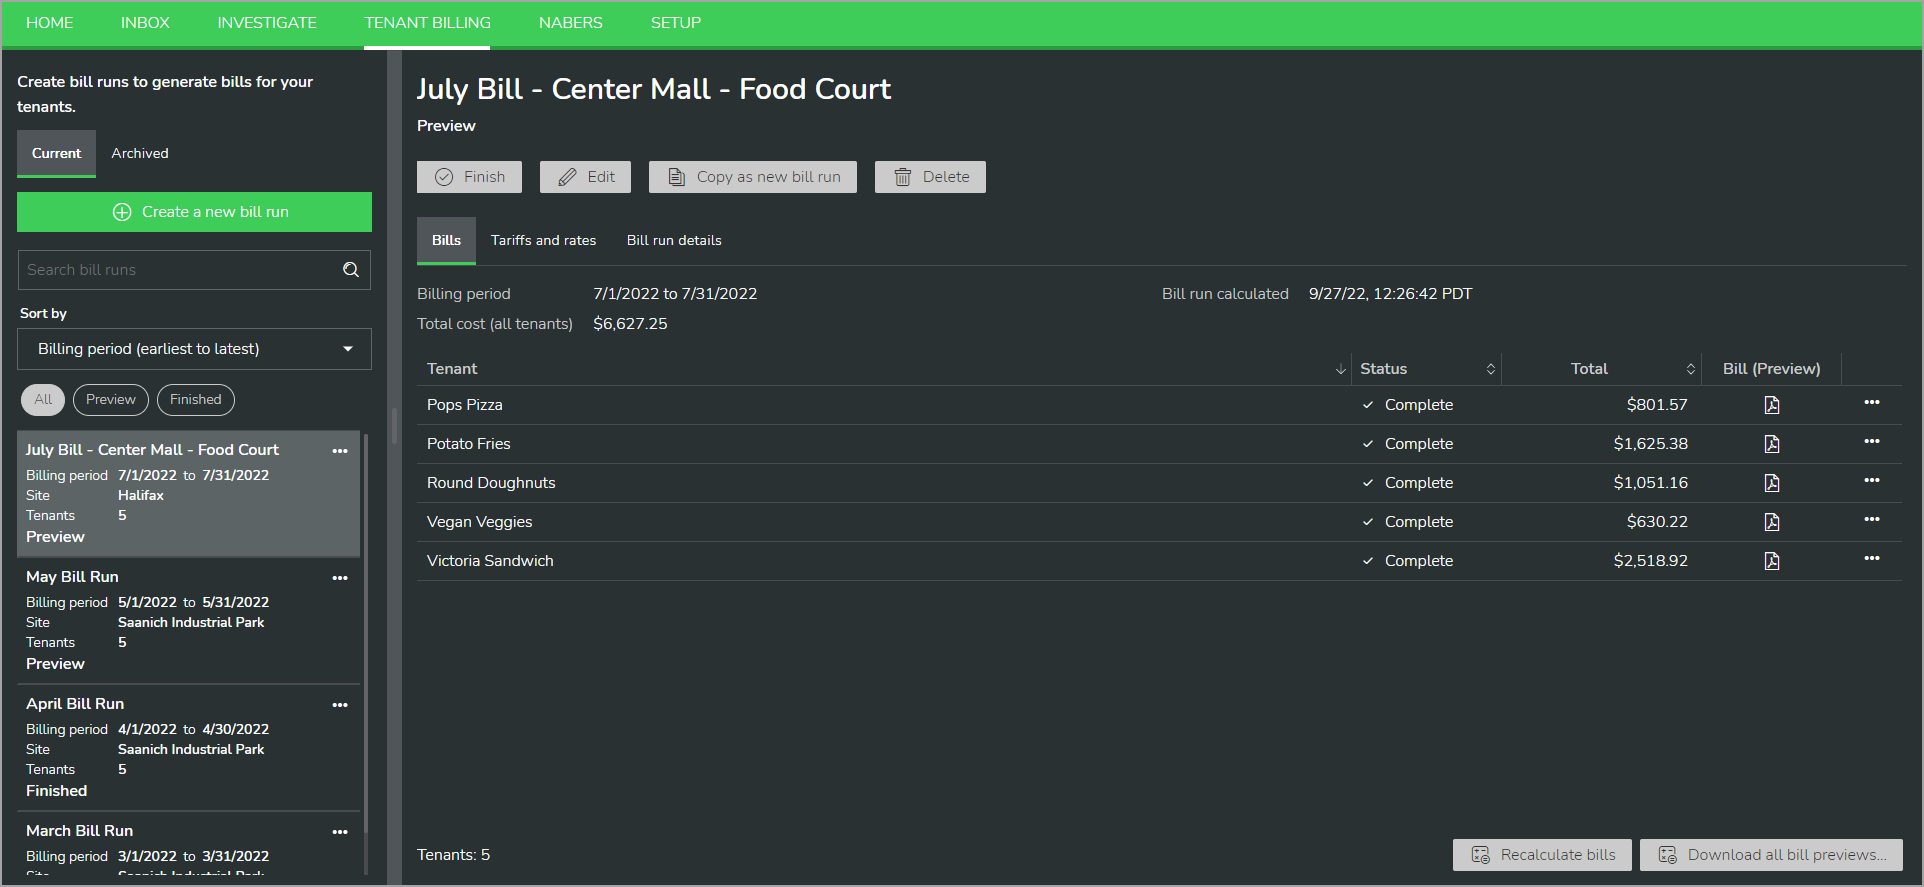
Tenant billing provides access to energy billing features for tenants in Energy Hub. The Tenant Billing UI includes a navigation panel on the left for creating and managing tenant bill runs, and a display panel on the right to show details for the selected bill run.
- Tenant billing is only for electricity, not for water or gas.
- Tenant billing supports up to 500 tenants.
The following shows a Tenant Billing example (shown in dark mode):
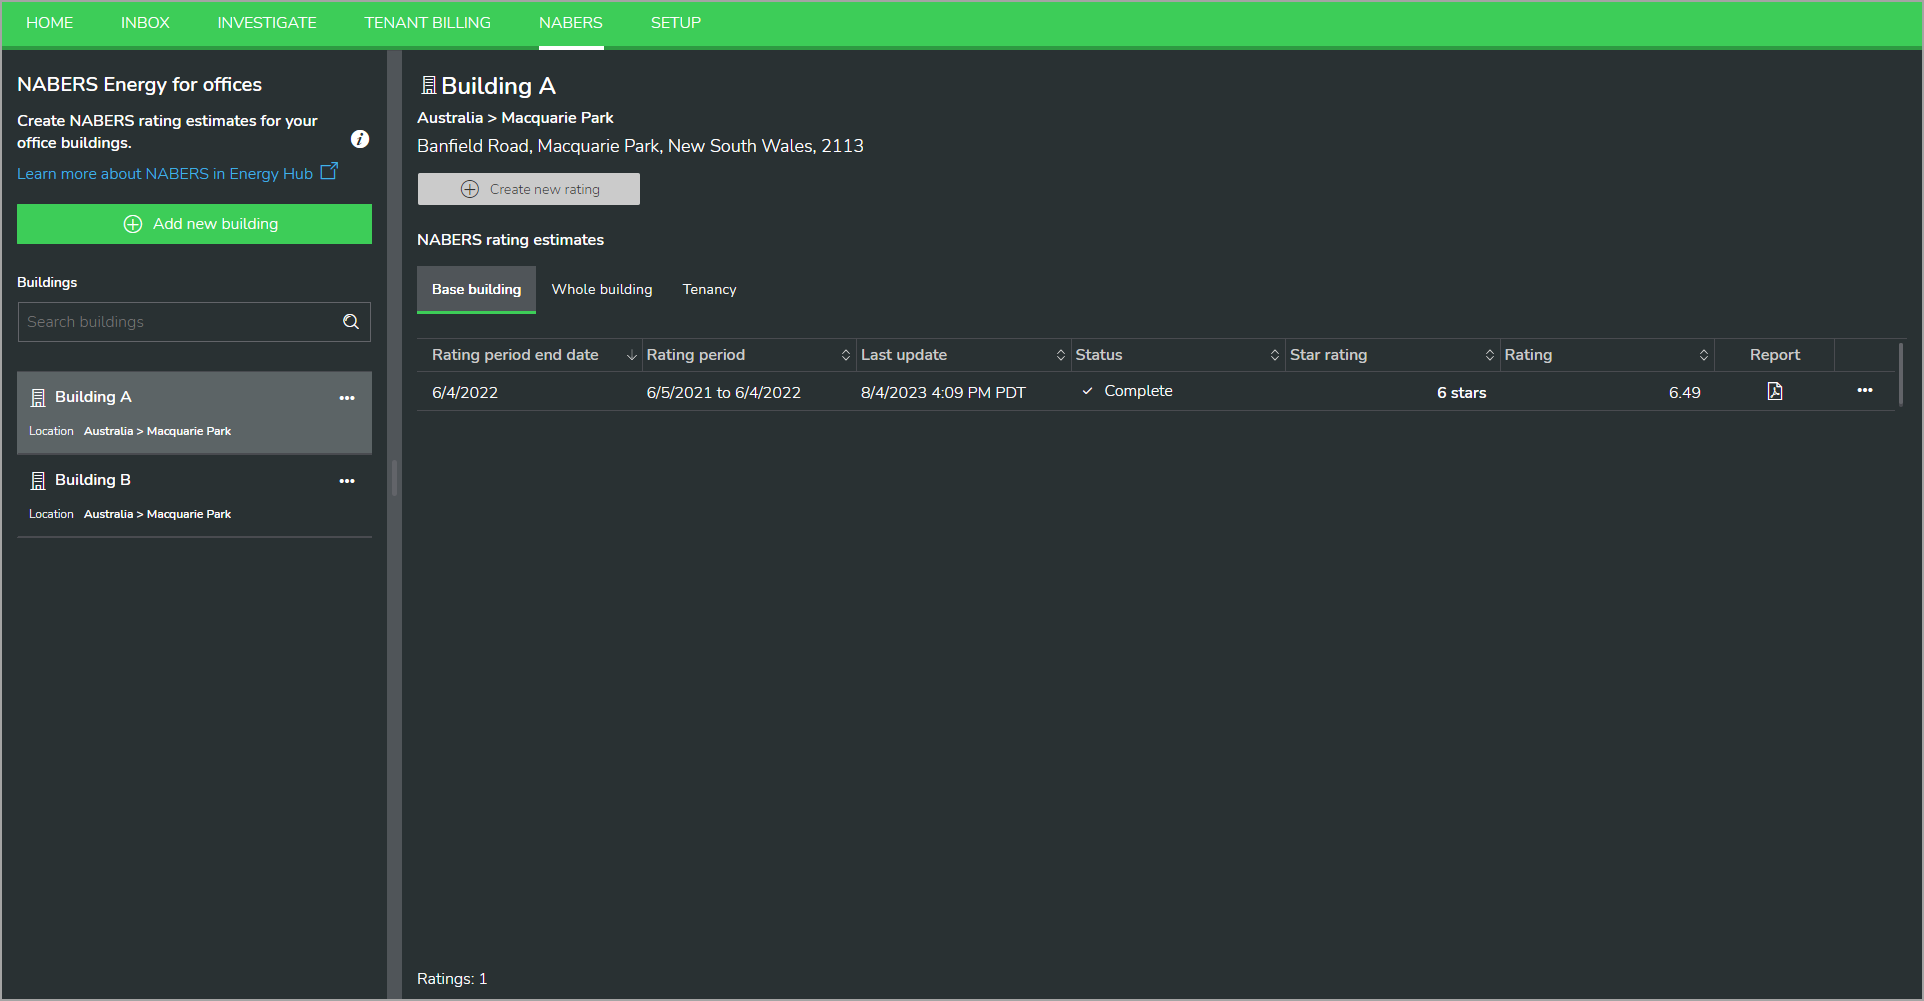
NABERS provides access to the NABERS energy for office buildings rating system functionality in Energy Hub. The NABERS UI includes a navigation panel on the left for adding and managing NABERS buildings, and a display panel on the right to show details for the selected building.
The following shows a NABERS example (shown in dark mode):

Setup gives access to configuration and settings in Energy Hub. The Setup UI includes a navigation panel on the left for selecting a setup option, and a display panel on the right to show details for the selected setup option. The following setup options exist: Organization settings, User preferences, Notification settings, Users, System setup, Subscriptions.
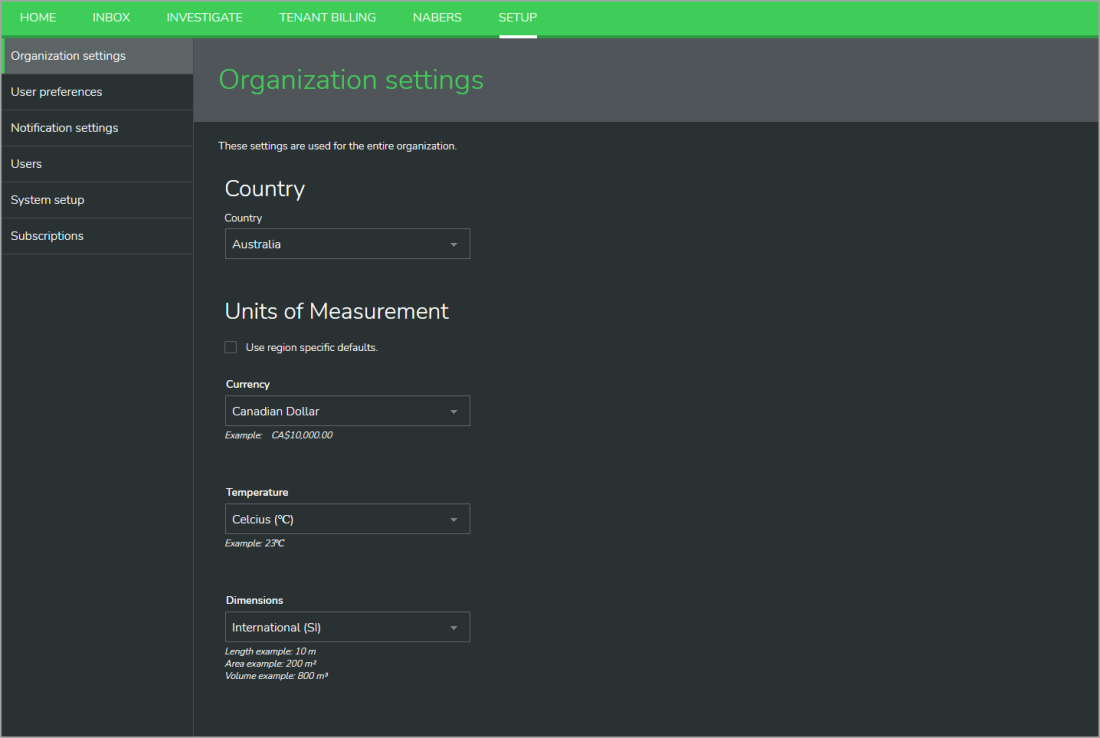
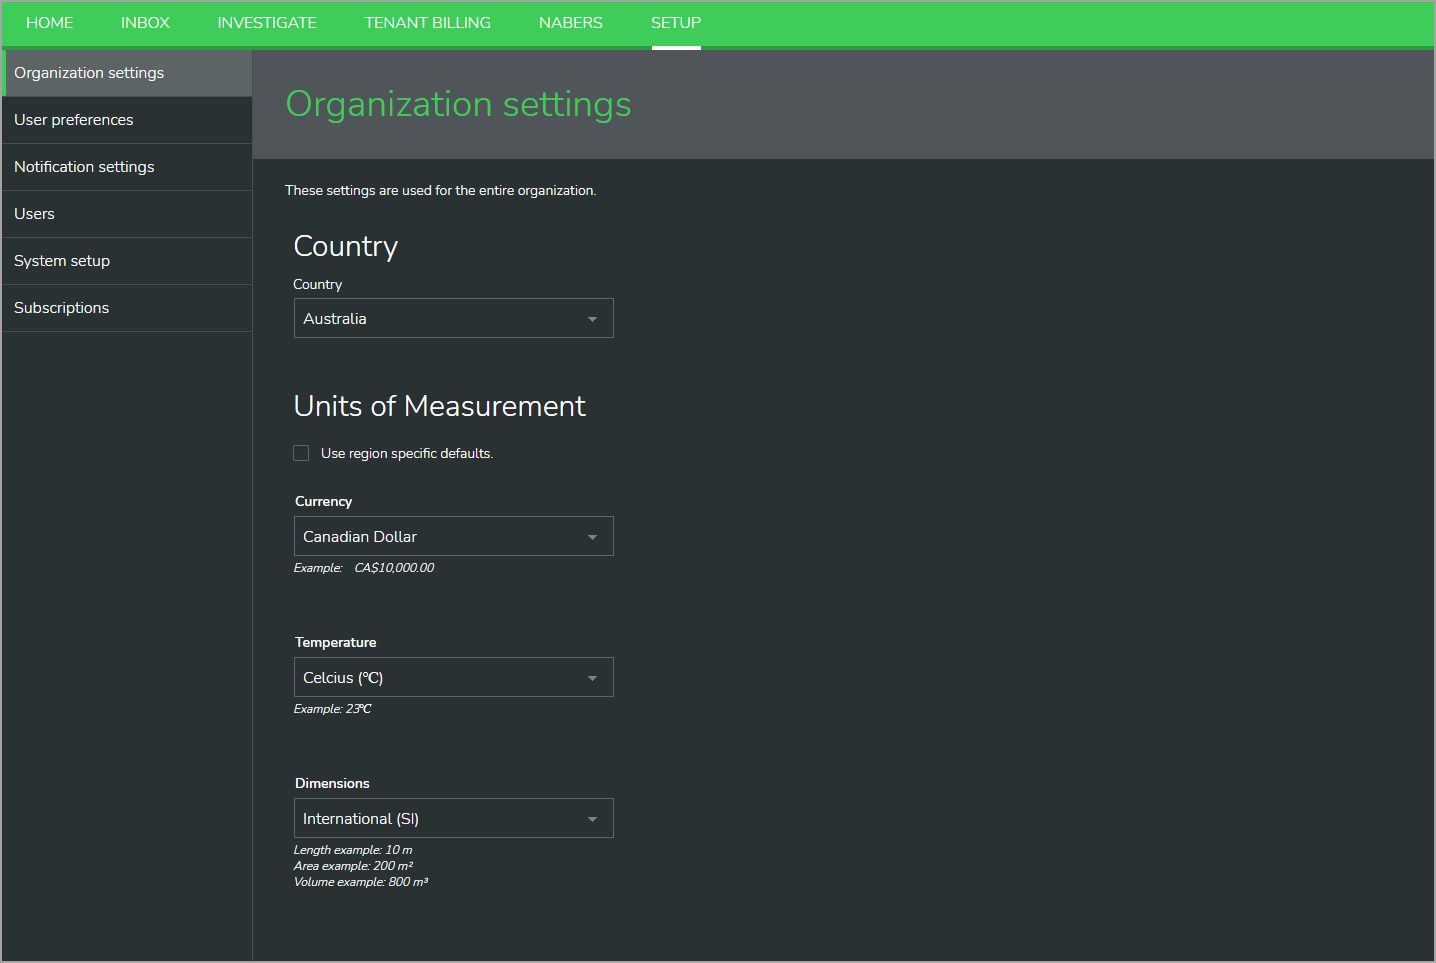
Organization settings determine the country and units of measurement for your organization in Energy Hub.
The following shows an organization settings example (shown in dark mode):
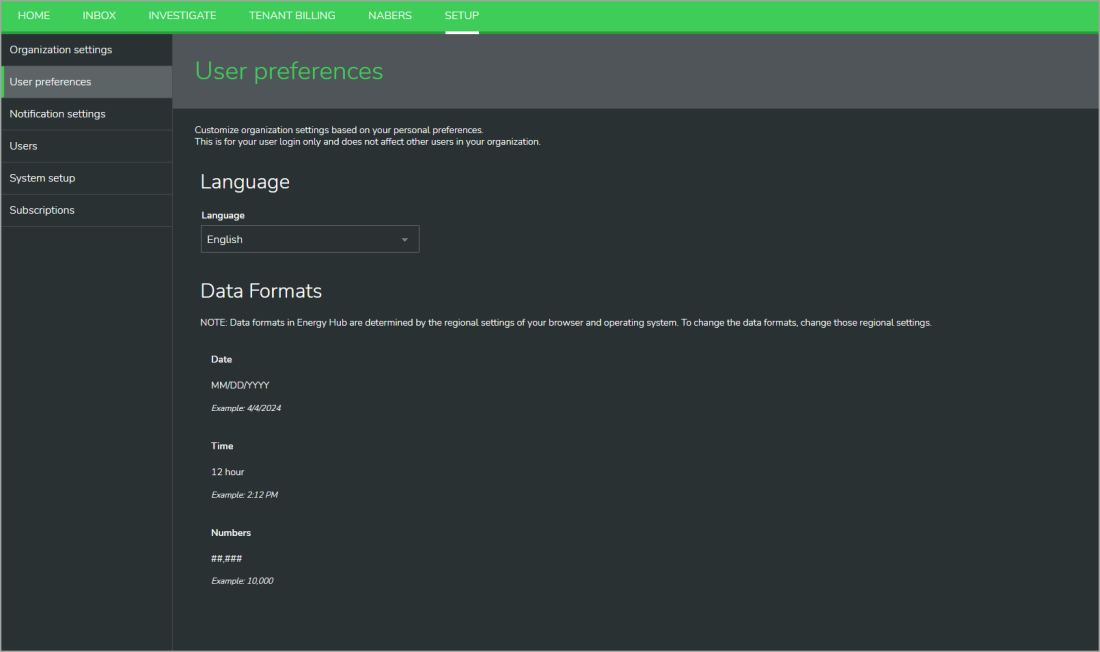
User preferences determine the language and data formats for your user account in Energy Hub.
The following shows a user preferences example (shown in dark mode):

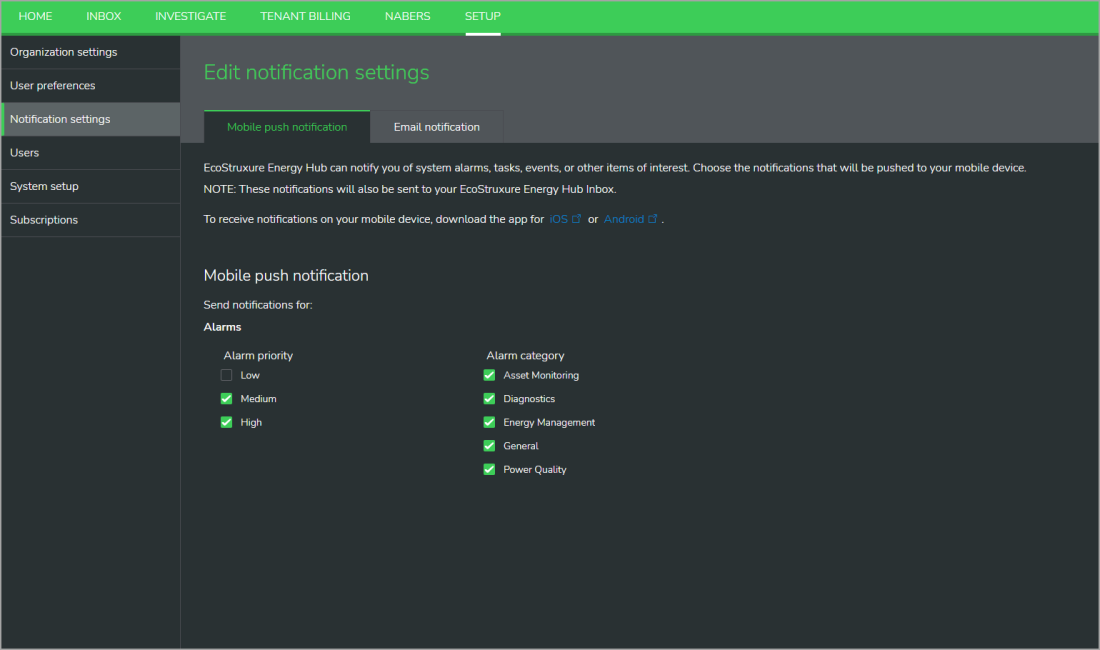
Notification settings determine the notification preferences for your user account in Energy Hub.
The following shows a notification settings example (shown in dark mode):

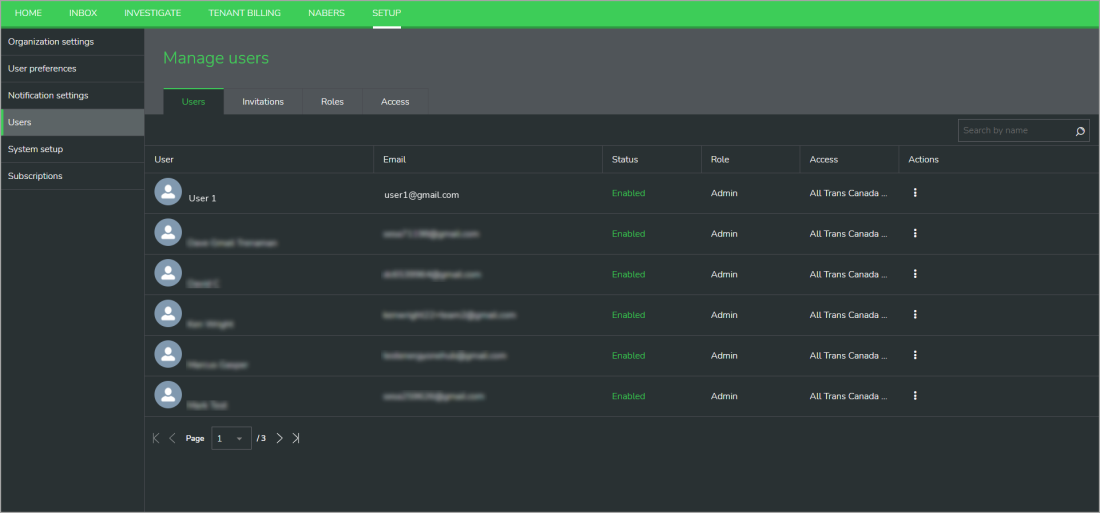
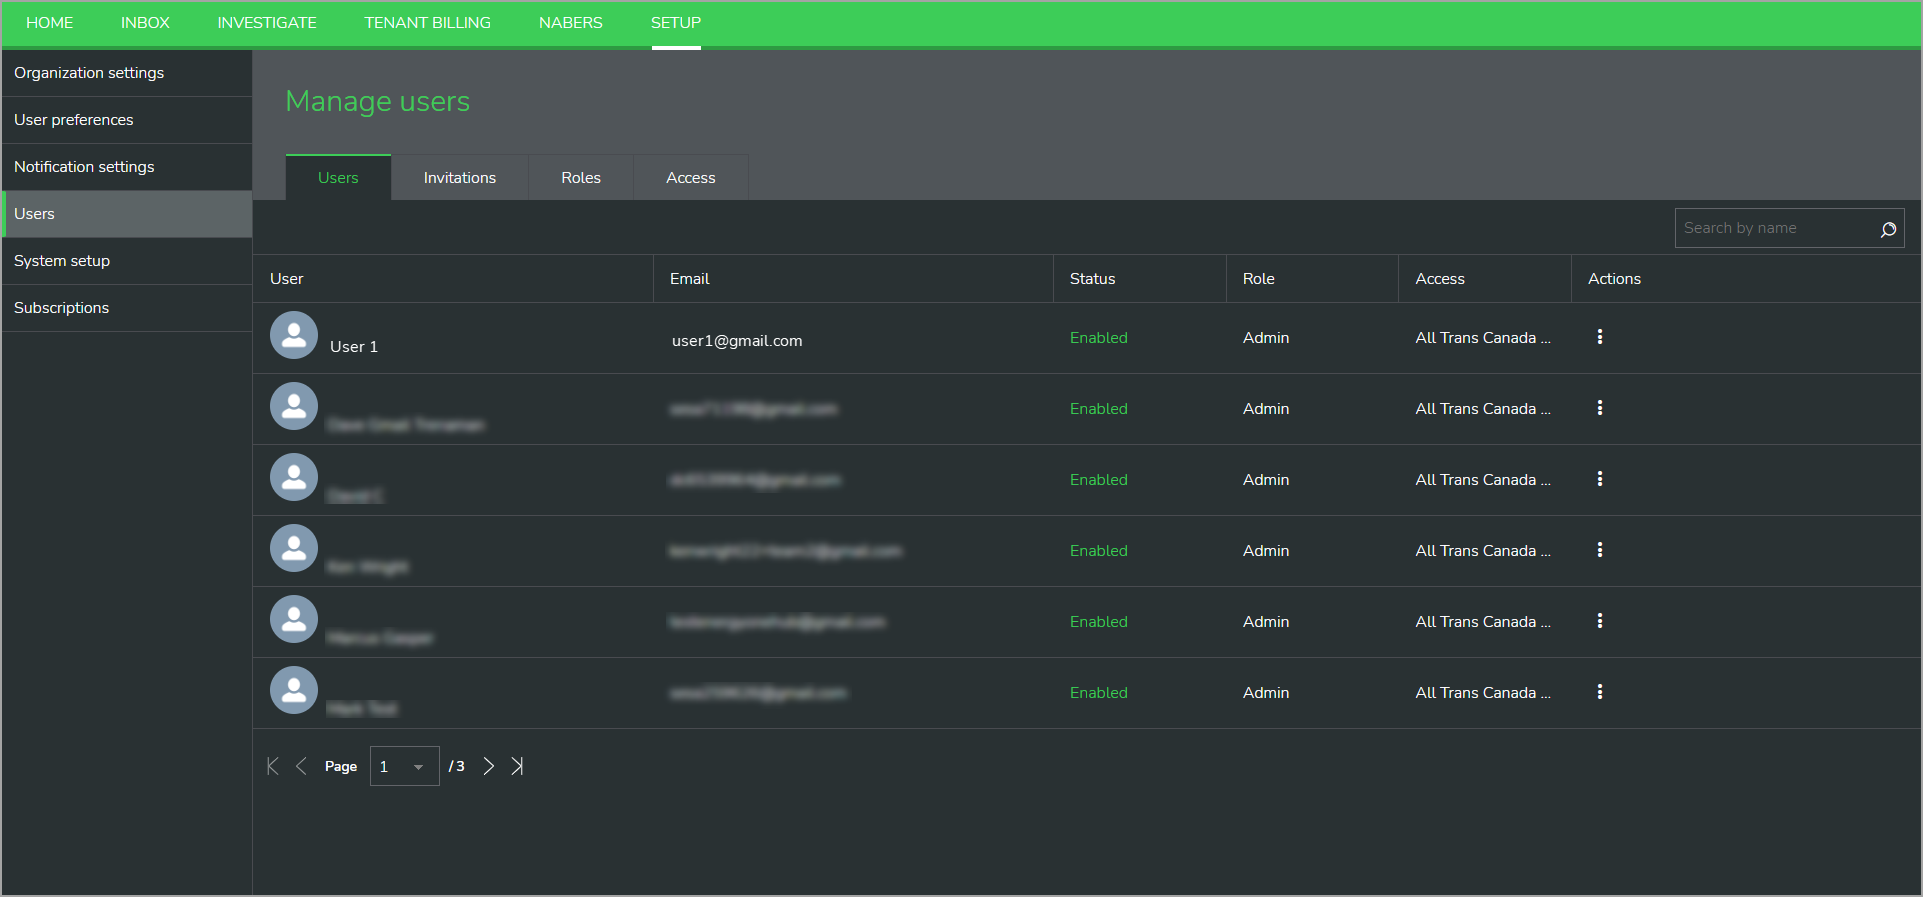
Users gives access to the user account management in Energy Hub.
The following shows a manage users example (shown in dark mode):
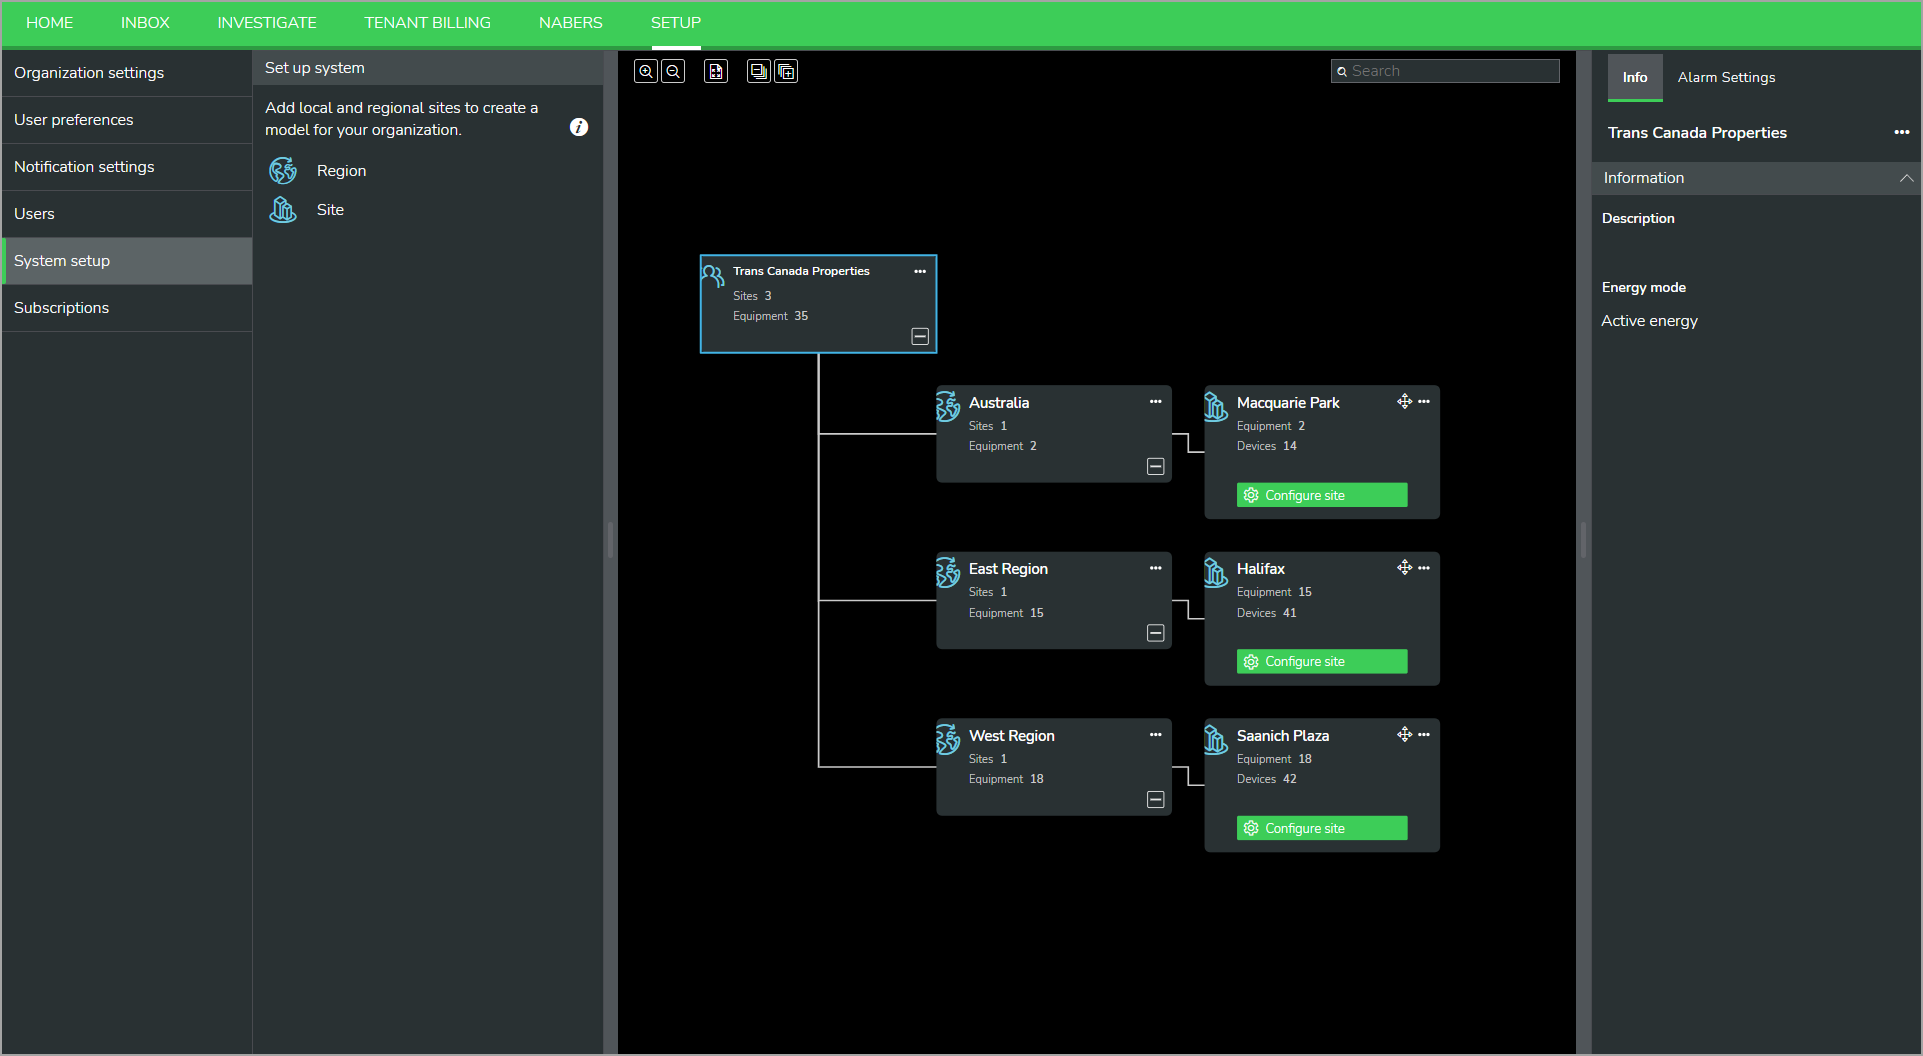
System setup gives access to the configuration of the organization model, tenant management for tenant energy billing, and other system setup and configuration tasks in Energy Hub.
System setup (Regions)
The following shows a system setup example for adding regions and sites (shown in dark mode):

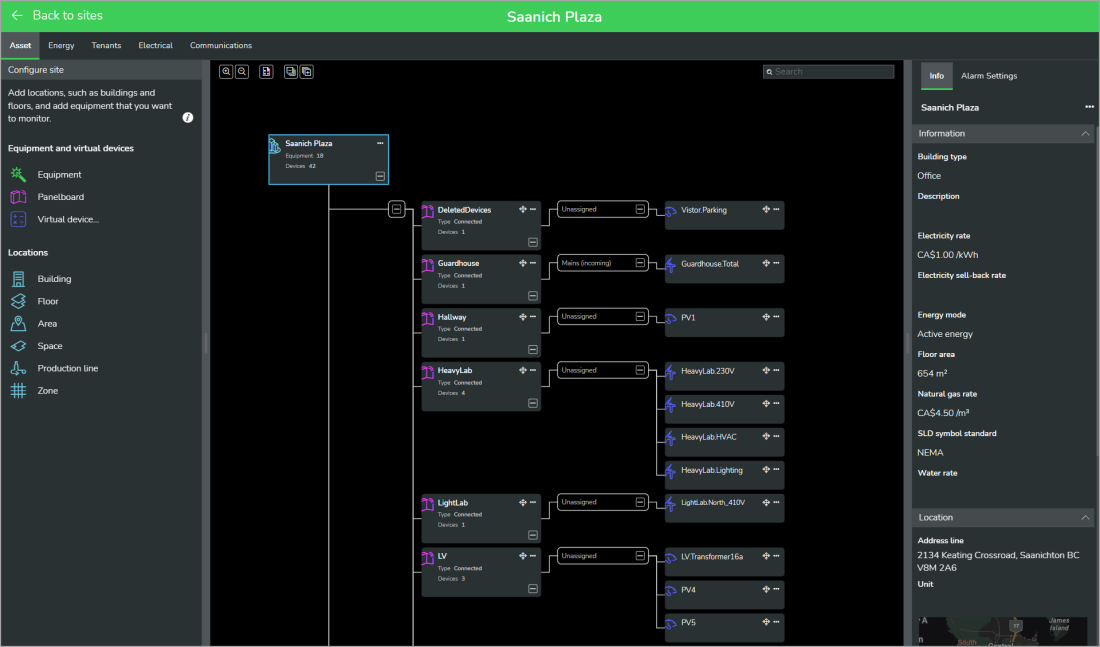
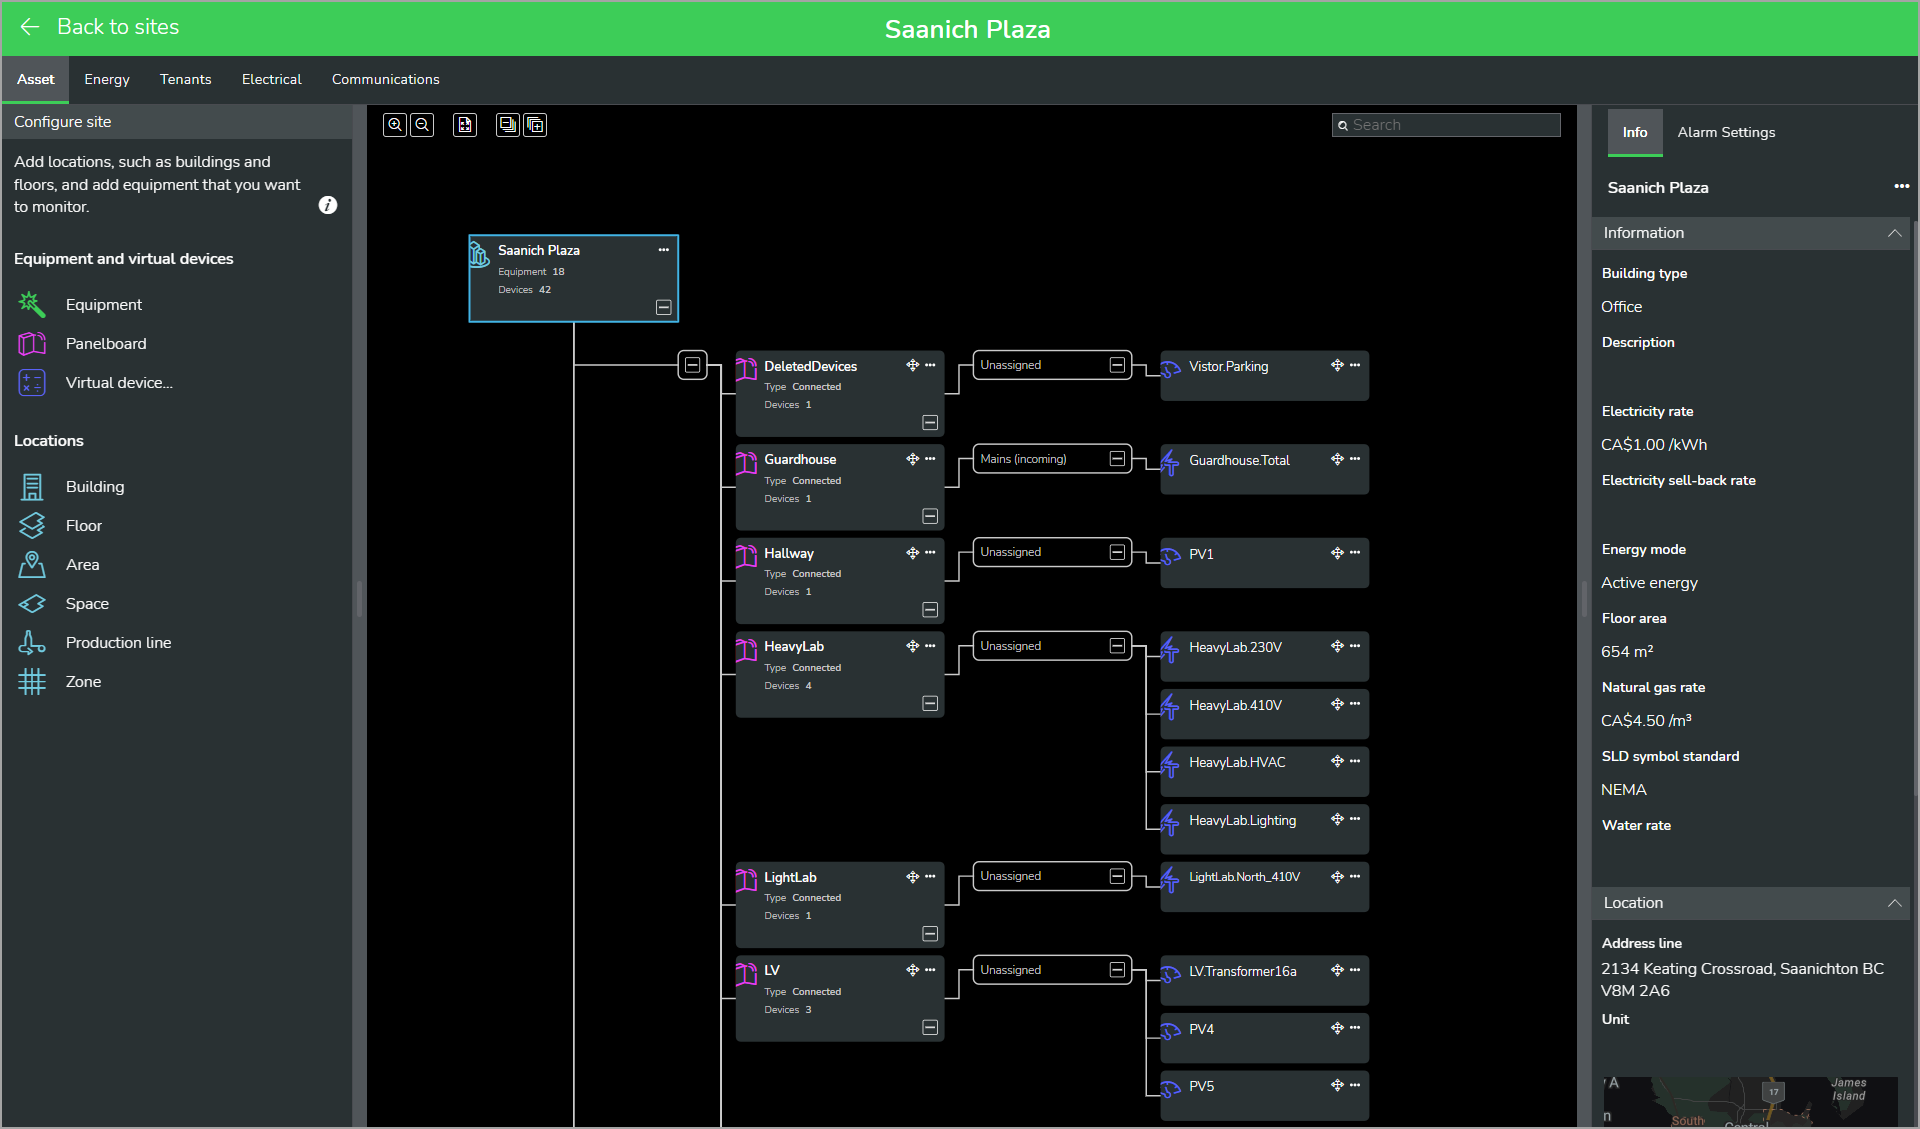
System setup (Sites - Asset view)
The following shows a system setup example for configuring the asset model for sites (shown in dark mode):
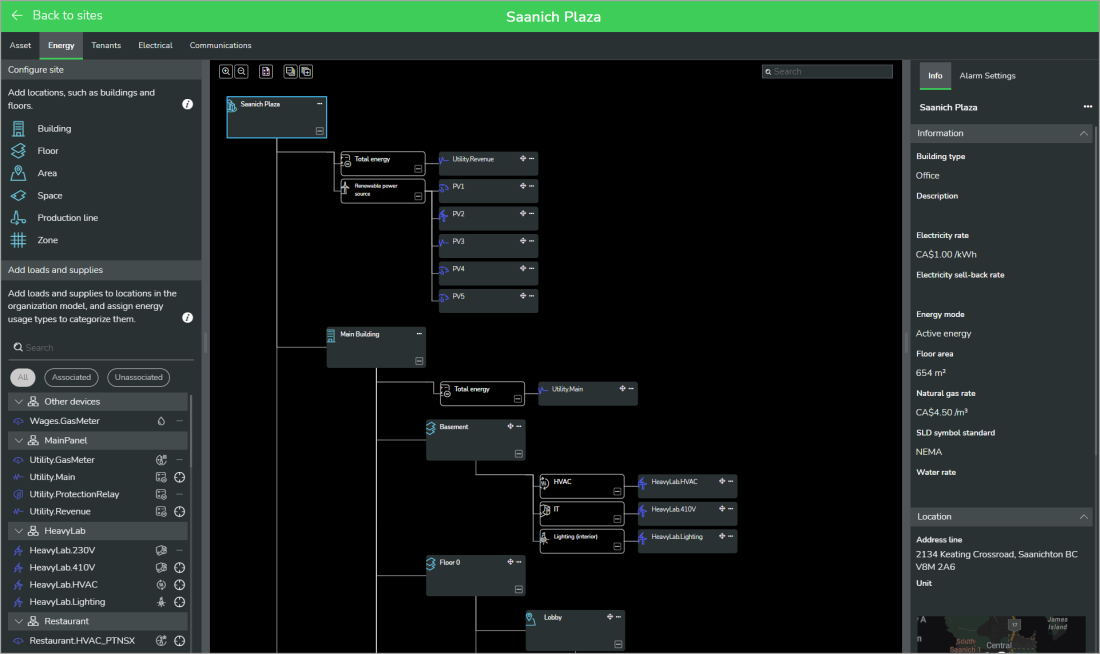
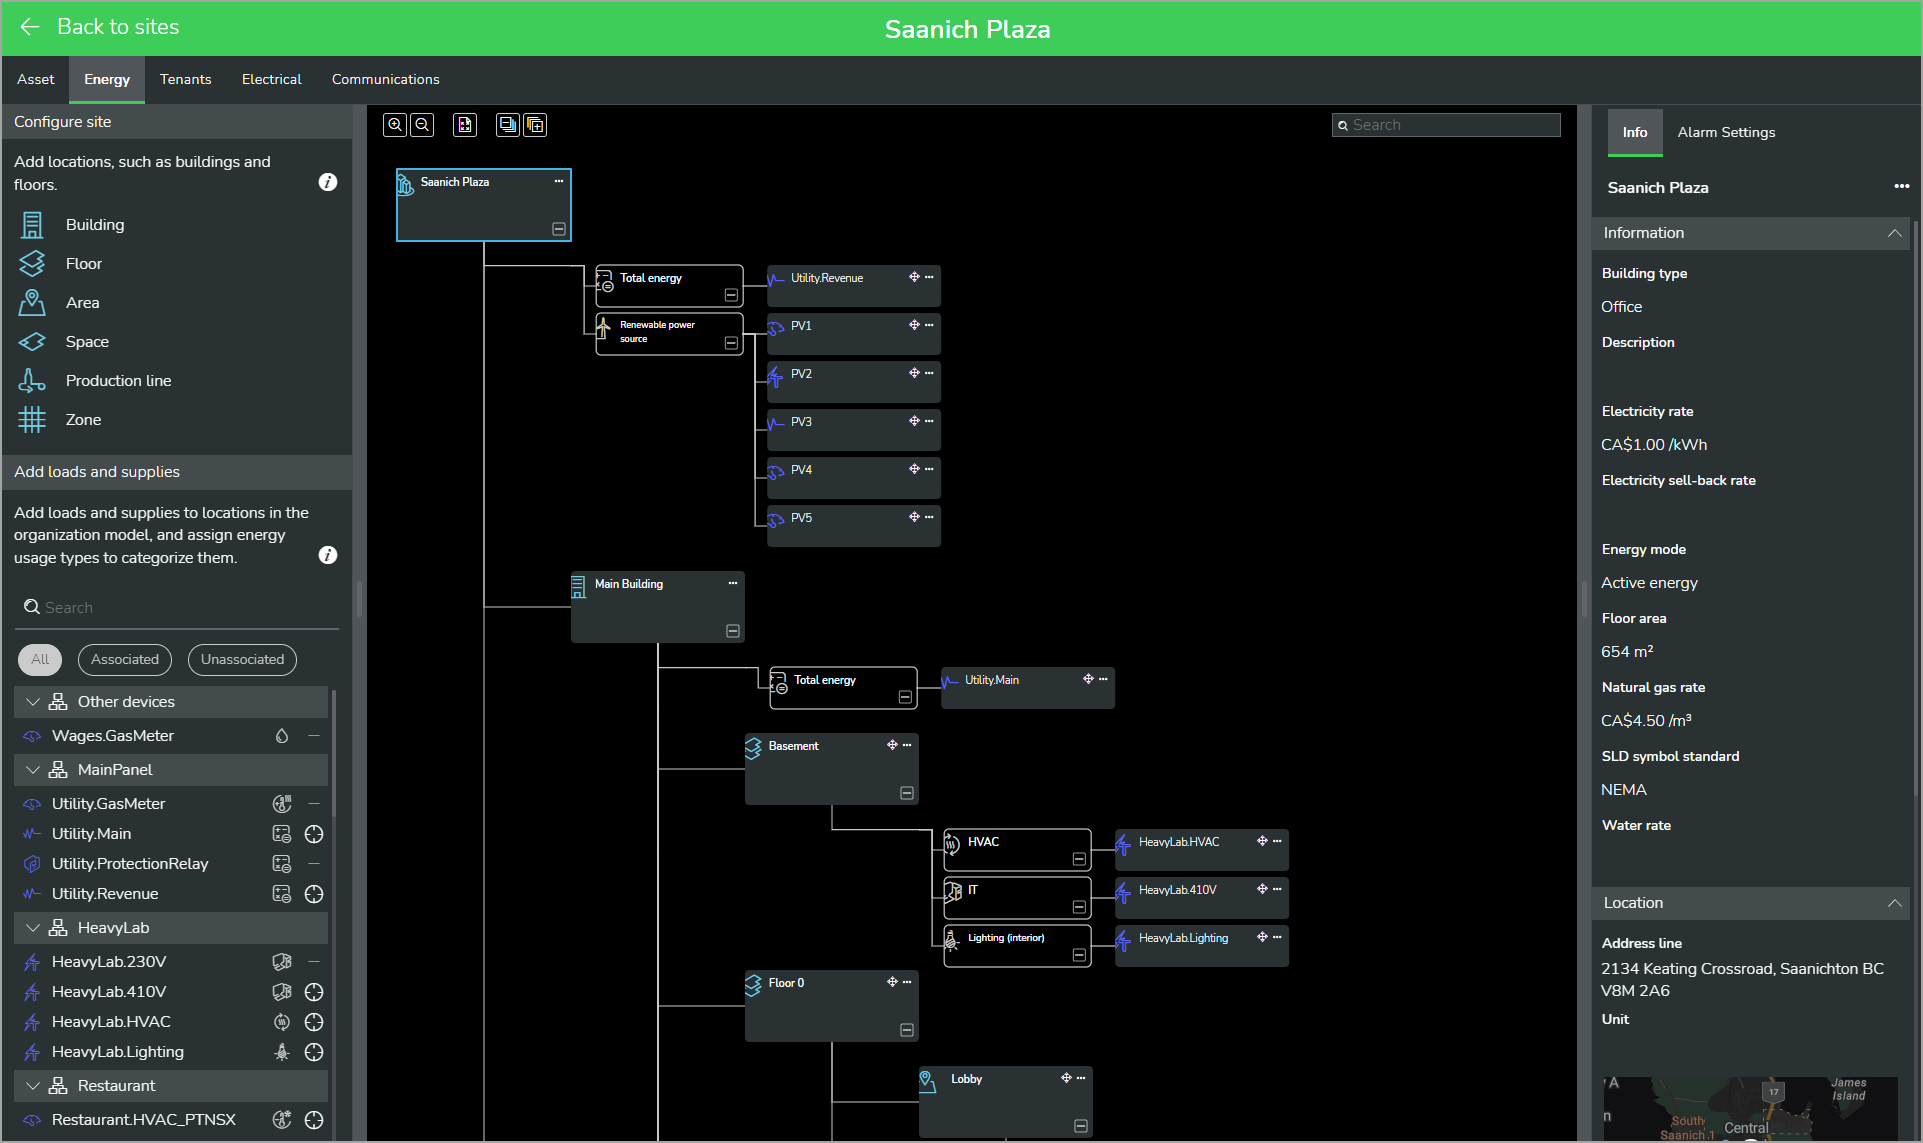
System setup (Sites - Energy view)
The following shows a system setup example for configuring the energy model for sites (shown in dark mode):
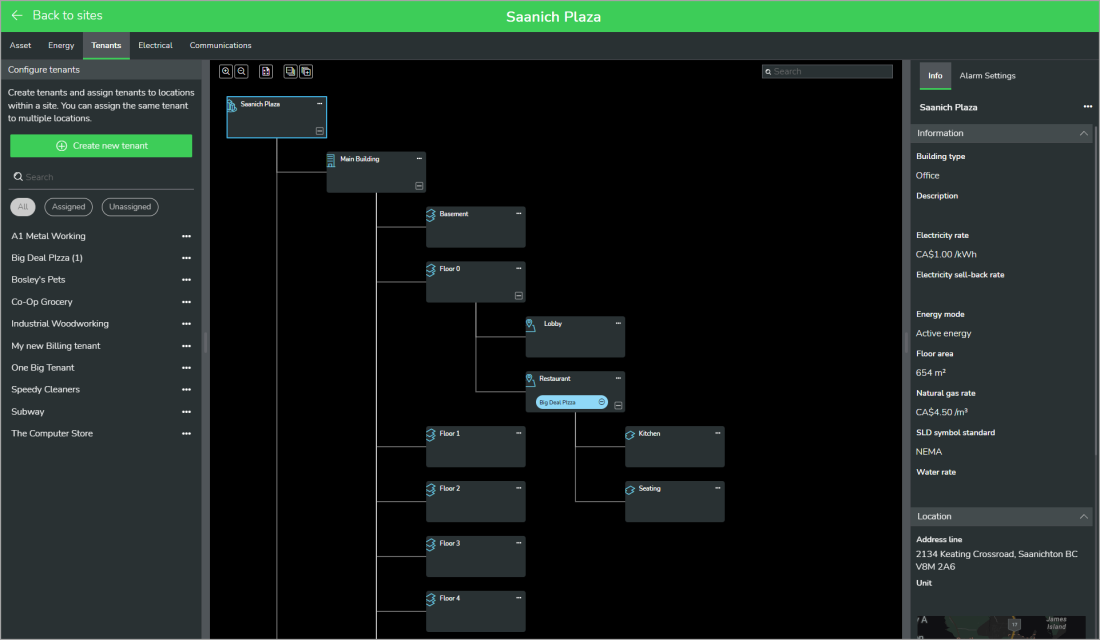
System setup (Sites - Tenants view)
The following shows a system setup example for configuring tenant billing (shown in dark mode):

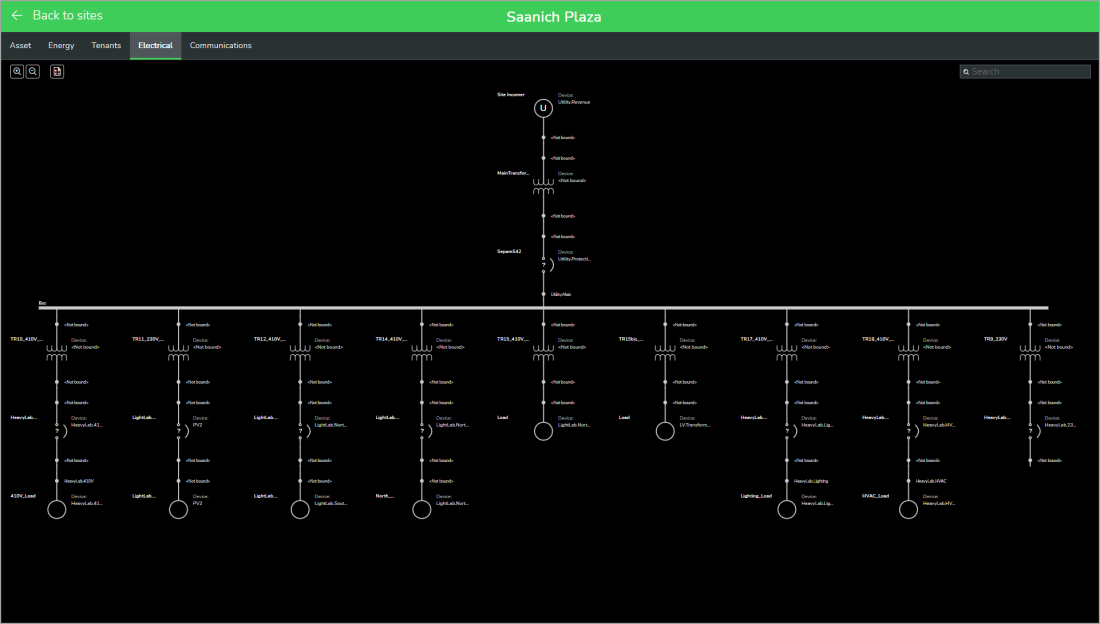
System setup (Sites - Electrical view)
The following shows a system setup example for configuring single-line diagrams for sites (shown in dark mode):

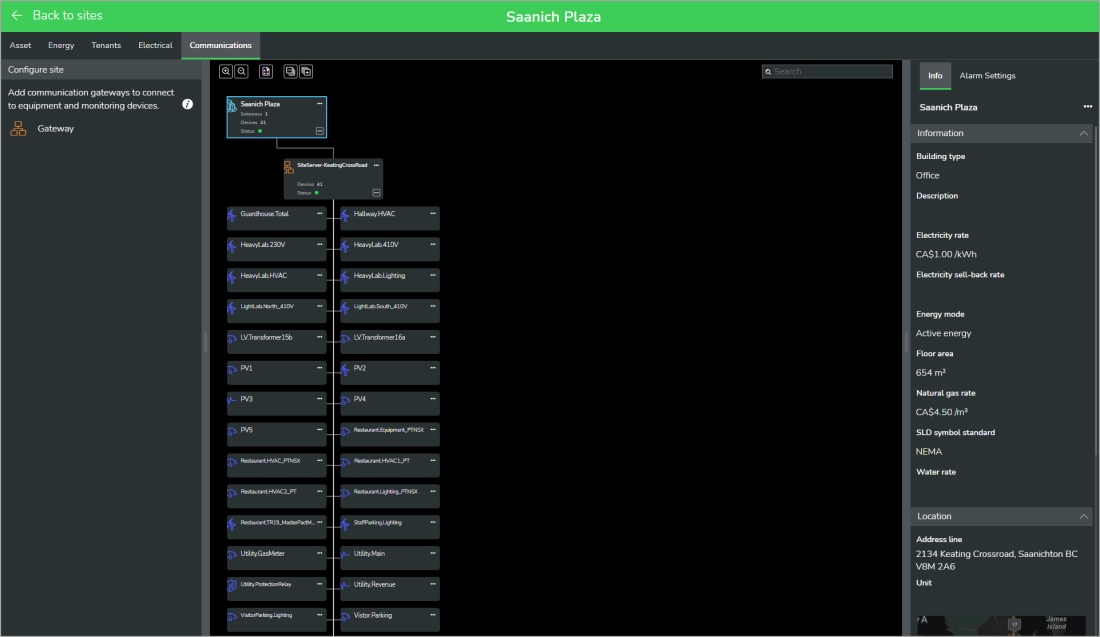
System setup (Sites - Communications view)
The following shows a system setup example for adding communication gateways for sites (shown in dark mode):

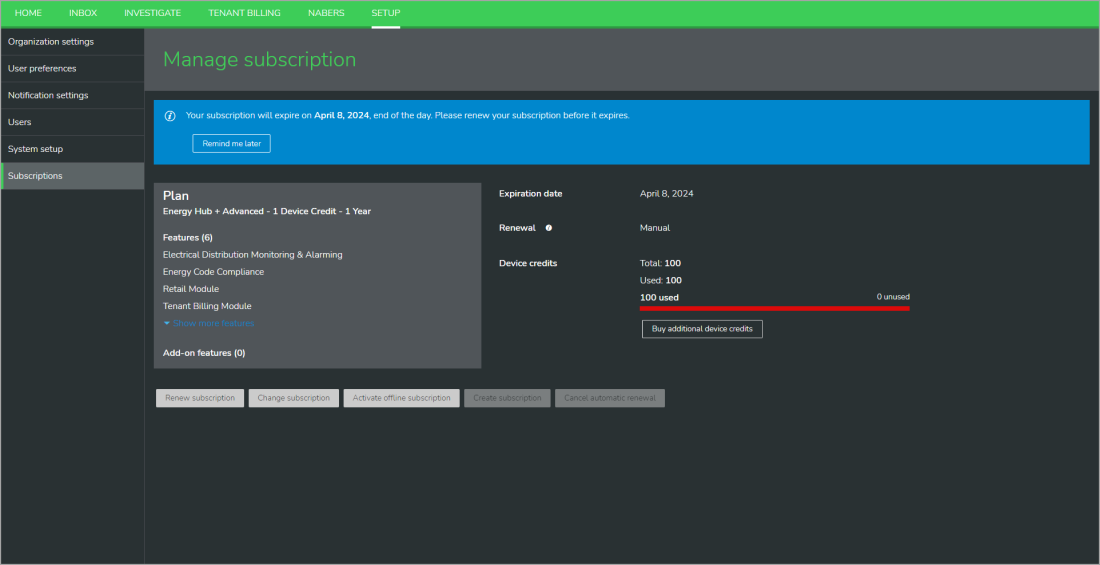
Subscriptions gives access to the feature plan subscription management in Energy Hub.
The following shows a manage subscriptions example (shown in dark mode):

For detailed information on the features and functions that are available in Energy Hub, see Applications.
[Site Manager mode]
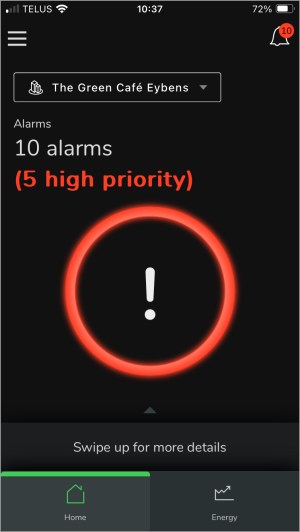
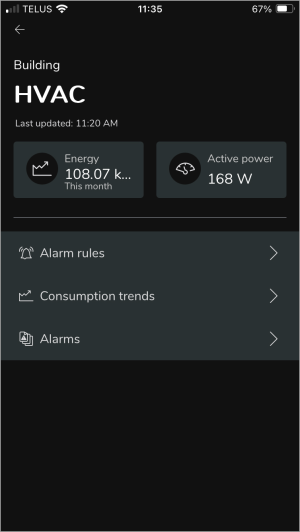
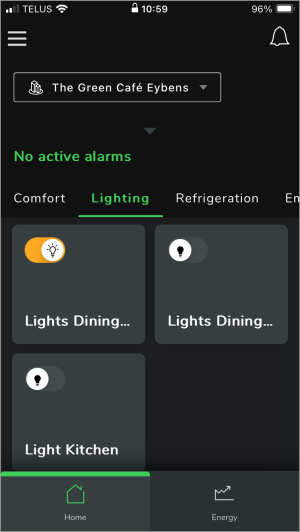
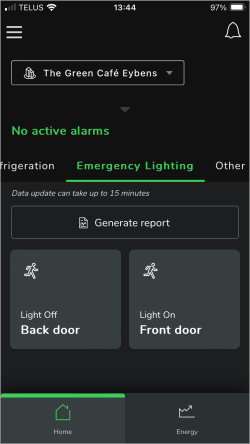
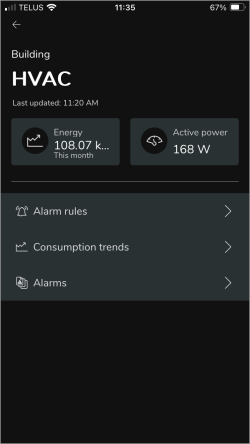
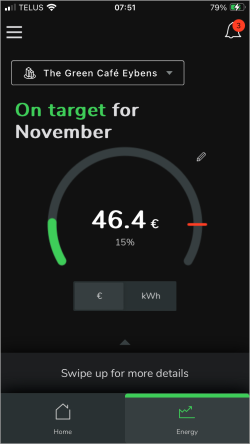
Home offers important information and features for daily facility operations, like alarms, load status monitoring, and load control.
The following shows Home examples (shown in dark mode):
|

|
|
|


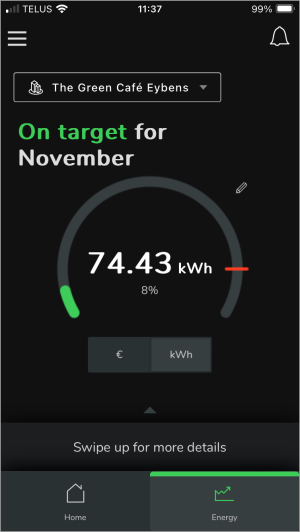
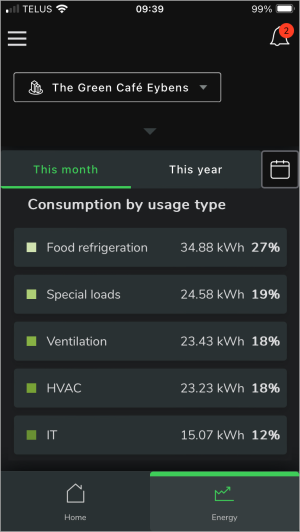
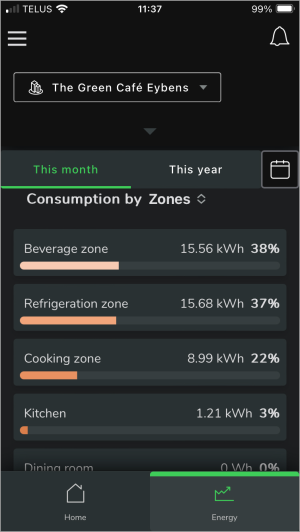
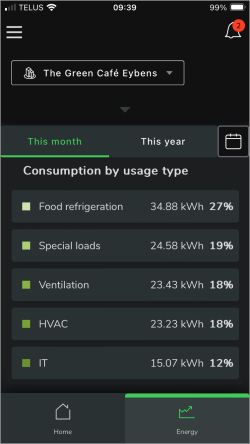
Energy provides specific information about energy performance at your site, including tracking and ranking of consumption and cost.
The following shows Energy examples (shown in dark mode):
|

|
|
|


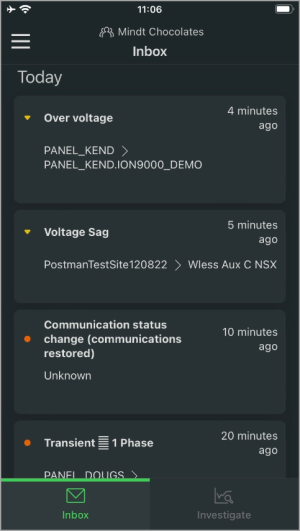
[Technician mode]
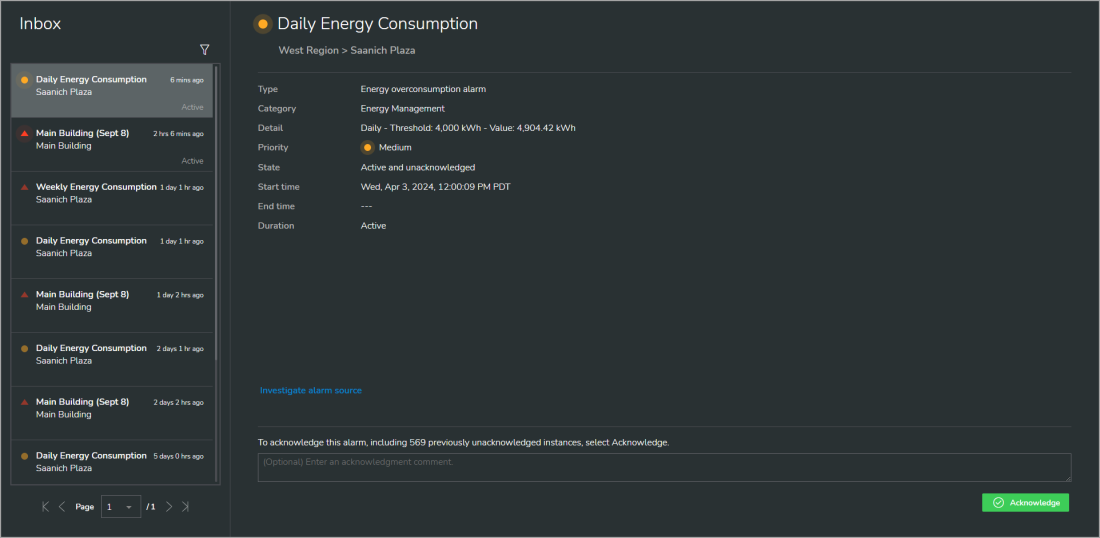
Inbox displays alarm information for the entire organization, based on the notification settings.
The following shows an Inbox example (shown in dark mode):
|

|
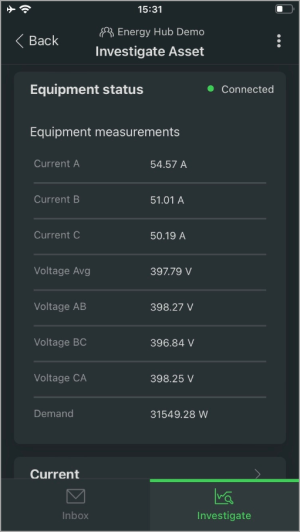
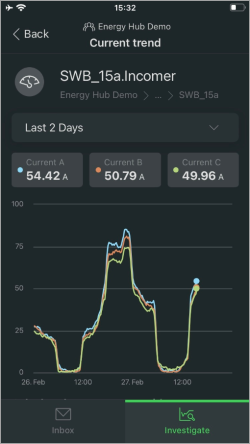
Investigate displays energy system data, including equipment status and voltage and current trends for chosen locations or devices.
The following shows Investigate examples (shown in dark mode):
|
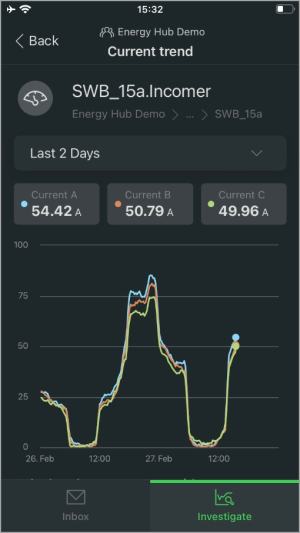
|

For detailed information on the features and functions that are available in the mobile app, see Energy Hub mobile app.