Data displays
Energy Hub uses data displays to show energy system data in the web app and the mobile app. The data that is displayed includes totals, trends, status, analysis results, insights, and the most recent measurement readings. The following shows examples of Energy Hub data displays and the locations, equipment, and devices in the organization model they are used for.
NOTE: The functionality displayed in this topic might not be the same as what you see for your organization. Your Energy Hub feature plan subscription determines which functions and features are available for your organization. For feature plan details, see Feature plans.
NOTE: Always consider the Safety Precautions when using information provided by Energy Hub for decision making.
[Web app]
Home
The data displays in Home show pre-selected information for the entire organization. You can interact with some of the data displays by selecting display options, but you cannot select locations, equipment, or devices.
Inbox
The data displays in Inbox show alarm information for the entire organization, based on the notification settings. You can set alarm filters for Inbox, but you cannot select locations, equipment, or devices.
Investigate
The data displays in Investigate show energy system data for different information views. You can select locations, equipment, or devices to view load specific data.
| Data display | Organization | Region | Site | Building | Floor | Area | Space | Production line | Zone | Equipment | Monitoring device |
|---|---|---|---|---|---|---|---|---|---|---|---|
| Alarms by location | ■ | ■ | ■ | ■ | ■ | ■ | ■ | ■ | ■ | - | - |
| Alarms summary | ■ | ■ | ■ | ■ | ■ | ■ | ■ | ■ | ■ | ■ | ■ |
| Equipment status | - | - | - | - | - | - | - | - | - | ■ | ■ |
| Trends | - | - | - | - | - | - | - | - | - | ■ | ■ |
| Data display | Organization | Region | Site | Building |
|---|---|---|---|---|
| Alarms by location | ■ | ■ | ■ | ■ |
| Alarms summary | ■ | ■ | ■ | ■ |
| Equipment status | - | - | - | - |
| Trends | - | - | - | - |
Asset view (continued)
| Data display | Floor | Area | Space | Production line |
|---|---|---|---|---|
| Alarms by location | ■ | ■ | ■ | ■ |
| Alarms summary | ■ | ■ | ■ | ■ |
| Equipment status | - | - | - | - |
| Trends | - | - | - | - |
Asset view (continued)
| Data display | Zone | Equipment | Monitoring device |
|---|---|---|---|
| Alarms by location | ■ | - | - |
| Alarms summary | ■ | ■ | ■ |
| Equipment status | - | ■ | ■ |
| Trends | - | ■ | ■ |
| Data display | Organization | Region | Site | Building | Floor | Area | Space | Production line | Zone | Monitoring device |
|---|---|---|---|---|---|---|---|---|---|---|
| Demand | ■ | ■ | ■ | ■ | ■ | ■ | ■ | ■ | ■ | ■ |
| Demand trend | - | - | - | - | - | - | - | - | - | ■ |
| Energy consumption (and generation) | ■ | ■ | ■ | ■ | ■ | ■ | ■ | ■ | ■ | ■ |
| Energy consumption by business hours | - | - | ■ | ■ | ■ | ■ | ■ | ■ | ■ | ■ |
| Energy consumption by business hours and usage type | - | - | ■ | ■ | ■ | ■ | ■ | ■ | ■ | ■ |
| Energy consumption by location | ■ | ■ | ■ | ■ | ■ | ■ | ■ | ■ | ■ | - |
| Energy consumption by usage type | ■ | ■ | ■ | ■ | ■ | ■ | ■ | ■ | ■ | - |
| Energy consumption normalized by degree days | - | - | ■ | ■ | ■ | ■ | ■ | ■ | ■ | ■ |
| Energy flow | ■ | ■ | ■ | - | - | - | - | - | - | - |
| Energy intensity | ■ | ■ | ■ | ■ | ■ | ■ | ■ | - | ■ | - |
| Energy intensity by location | ■ | ■ | ■ | ■ | ■ | ■ | ■ | - | ■ | - |
| Energy trend | - | - | - | - | - | - | - | - | - | ■ |
| Gas consumption | ■ | ■ | ■ | ■ | ■ | ■ | ■ | ■ | ■ | ■ |
| Water consumption | ■ | ■ | ■ | ■ | ■ | ■ | ■ | ■ | ■ | ■ |
| Water intensity | ■ | ■ | ■ | ■ | ■ | ■ | ■ | ■ | ■ | - |
| Water intensity by location | ■ | ■ | ■ | ■ | ■ | ■ | ■ | ■ | ■ | - |
| Data display | Organization | Region | Site | Building |
|---|---|---|---|---|
| Demand | ■ | ■ | ■ | ■ |
| Demand trend | - | - | - | - |
| Energy consumption (and generation) | ■ | ■ | ■ | ■ |
| Energy consumption by business hours | - | - | ■ | ■ |
| Energy consumption by business hours and usage type | - | - | ■ | ■ |
| Energy consumption by location | ■ | ■ | ■ | ■ |
| Energy consumption by usage type | ■ | ■ | ■ | ■ |
| Energy consumption normalized by degree days | - | - | ■ | ■ |
| Energy flow | ■ | ■ | ■ | - |
| Energy intensity | ■ | ■ | ■ | ■ |
| Energy intensity by location | ■ | ■ | ■ | ■ |
| Energy trend | - | - | - | - |
| Gas consumption | ■ | ■ | ■ | ■ |
| Water consumption | ■ | ■ | ■ | ■ |
| Water intensity | ■ | ■ | ■ | ■ |
| Water intensity by location | ■ | ■ | ■ | ■ |
Energy view (continued)
| Data display | Floor | Area | Space | Production line |
|---|---|---|---|---|
| Demand | ■ | ■ | ■ | ■ |
| Demand trend | - | - | - | - |
| Energy consumption (and generation) | ■ | ■ | ■ | ■ |
| Energy consumption by business hours | ■ | ■ | ■ | ■ |
| Energy consumption by business hours and usage type | ■ | ■ | ■ | ■ |
| Energy consumption by location | ■ | ■ | ■ | ■ |
| Energy consumption by usage type | ■ | ■ | ■ | ■ |
| Energy consumption normalized by degree days | ■ | ■ | ■ | ■ |
| Energy flow | - | - | - | - |
| Energy intensity | ■ | ■ | ■ | - |
| Energy intensity by location | ■ | ■ | ■ | - |
| Energy trend | - | - | - | - |
| Gas consumption | ■ | ■ | ■ | ■ |
| Water consumption | ■ | ■ | ■ | ■ |
| Water intensity | ■ | ■ | ■ | ■ |
| Water intensity by location | ■ | ■ | ■ | ■ |
Energy view (continued)
| Data display | Zone | Monitoring device |
|---|---|---|
| Demand | ■ | ■ |
| Demand trend | - | ■ |
| Energy consumption (and generation) | ■ | ■ |
| Energy consumption by business hours | ■ | ■ |
| Energy consumption by business hours and usage type | ■ | ■ |
| Energy consumption by location | ■ | - |
| Energy consumption by usage type | ■ | - |
| Energy consumption normalized by degree days | ■ | ■ |
| Energy flow | - | - |
| Energy intensity | ■ | - |
| Energy intensity by location | ■ | - |
| Energy trend | - | ■ |
| Gas consumption | ■ | ■ |
| Water consumption | ■ | ■ |
| Water intensity | ■ | - |
| Water intensity by location | ■ | - |
| Data display | Organization | Region | Site | Building | Floor | Area | Space | Production line | Zone | Monitoring device |
|---|---|---|---|---|---|---|---|---|---|---|
| Cost flow | - | - | ■ | - | - | - | - | - | - | - |
| Electricity cost | - | - | ■ | - | - | - | - | - | - | - |
| Water cost | - | - | ■ | - | - | - | - | - | - | - |
| Gas cost | - | - | ■ | - | - | - | - | - | - | - |
| Data display | Organization | Region | Site | Building |
|---|---|---|---|---|
| Cost flow | - | - | ■ | - |
| Electricity cost | - | - | ■ | - |
| Water cost | - | - | ■ | - |
| Gas cost | - | - | ■ | - |
Cost view (continued)
| Data display | Floor | Area | Space | Production line |
|---|---|---|---|---|
| Cost flow | - | - | - | - |
| Electricity cost | - | - | - | - |
| Water cost | - | - | - | - |
| Gas cost | - | - | - | - |
Cost view (continued)
| Data display | Zone | Monitoring device |
|---|---|---|
| Cost flow | - | - |
| Electricity cost | - | - |
| Water cost | - | - |
| Gas cost | - | - |
| Data display | Organization | Region | Site | Building | Floor | Area | Space | Production line | Zone | Equipment | Monitoring device |
|---|---|---|---|---|---|---|---|---|---|---|---|
| Single-line diagram | - | - | ■ | - | - | - | - | - | - | - | - |
| Data display | Organization | Region | Site | Building |
|---|---|---|---|---|
| Single-line diagram | - | - | ■ | - |
Electrical view (continued)
| Data display | Floor | Area | Space | Production line |
|---|---|---|---|---|
| Single-line diagram | - | - | - | - |
Electrical view (continued)
| Data display | Zone | Asset | Monitoring device |
|---|---|---|---|
| Single-line diagram | - | - | - |
Tenant Billing
Tenant billing displays tenant and energy bill related information based on the tenants that have been configured in Energy Hub and the bill runs you create.
NABERS
NABERS displays building energy rating related information based on the buildings you add to NABERS and the ratings you create.
[Mobile app]
Site manager mode:
Home
The data displays on the Home tab show site specific load information, such as alarm summary, load on / off status, and power consumption. You can also control loads and generate reports.
Energy
The data displays on the Energy tab show site specific energy performance information, such as consumption tracking against target, energy consumption ranking by location and usage type, and cost tracking.
Technician mode:
Inbox
The data displays on the Inbox tab show alarm information for the entire organization, based on the notification settings. You can set alarm filters for Inbox, but you cannot select locations, equipment, or devices.
Investigate
The data displays on the Investigate tab show energy system data, such as equipment status and voltage and current trends for selected locations, equipment, or devices.
The following shows examples of data displays in Energy Hub. The displays are grouped by high-level Energy Hub functions and user interfaces (UIs). For more information on these functions and UIs, see Functions and user interfaces (UIs).
Home
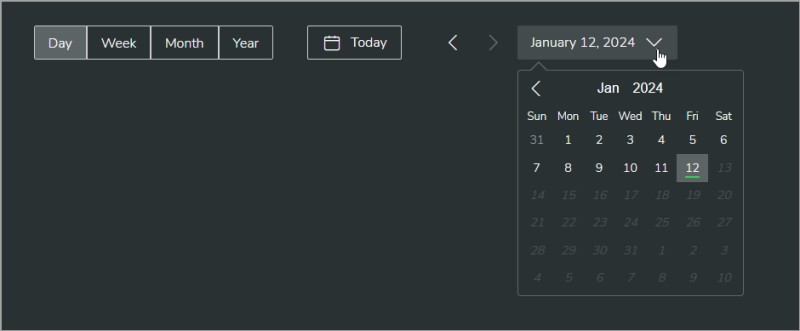
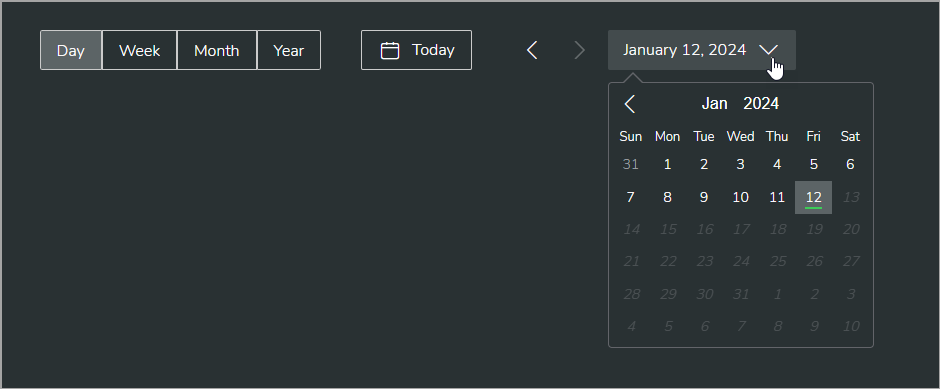
The data range selector sets the time range for relevant displays on the Home page.
TIP: Select the date range drop-down to open a calendar for date range selection.
Example (shown in dark mode):
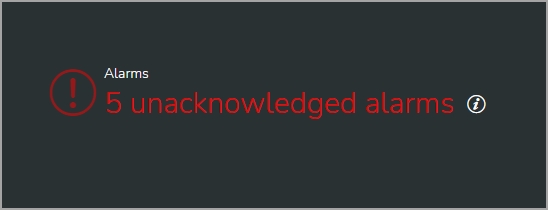
Alarm count shows the number of unacknowledged alarms for the organization.
TIP: Select the alarm count text to open Inbox with detailed alarm information.
Example (shown in dark mode):
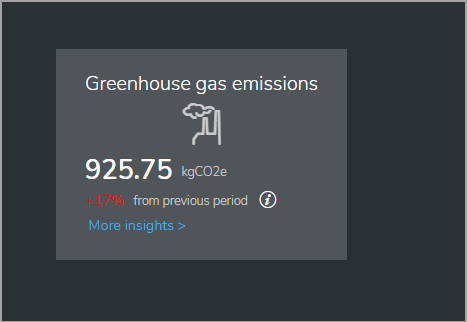
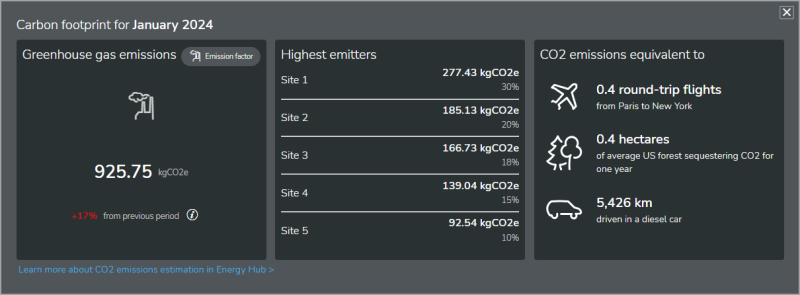
This display shows an estimate of the CO2e emissions produced by the organization. Select the More insights link in the display to see emissions details.
Examples (shown in dark mode):
Summary view
Details view
Summary view
Details view

This display shows information about significant changes in the energy consumption patterns of the organization. Energy Hub only displays this section when insights or recommendations are available.
Example (shown in dark mode):
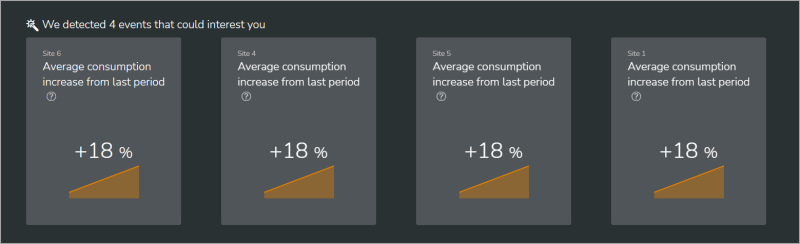
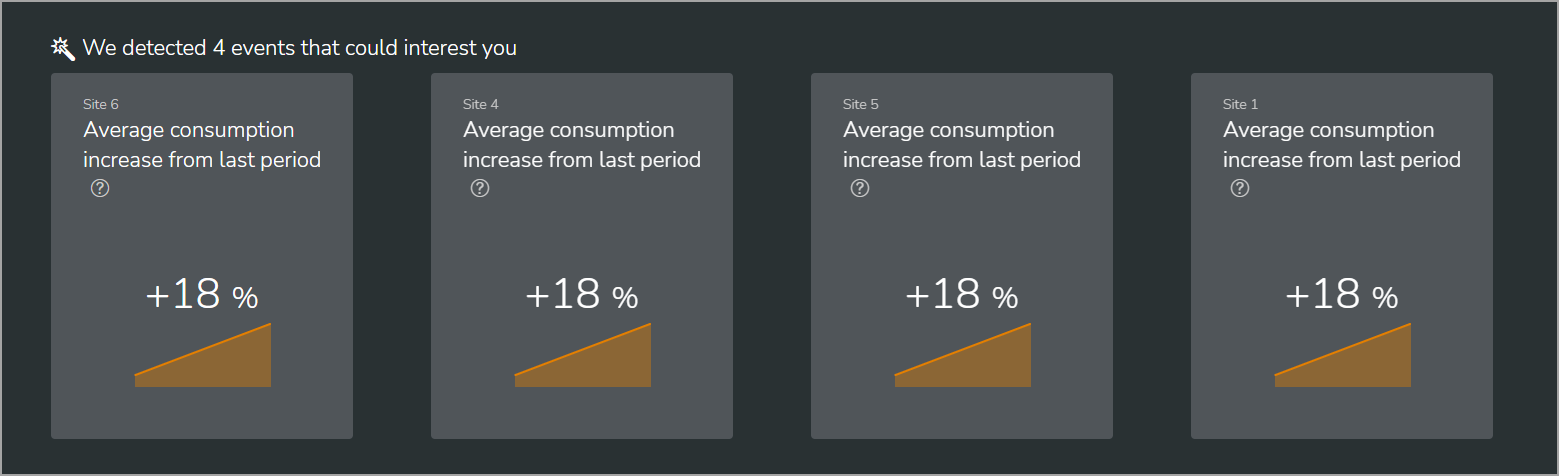
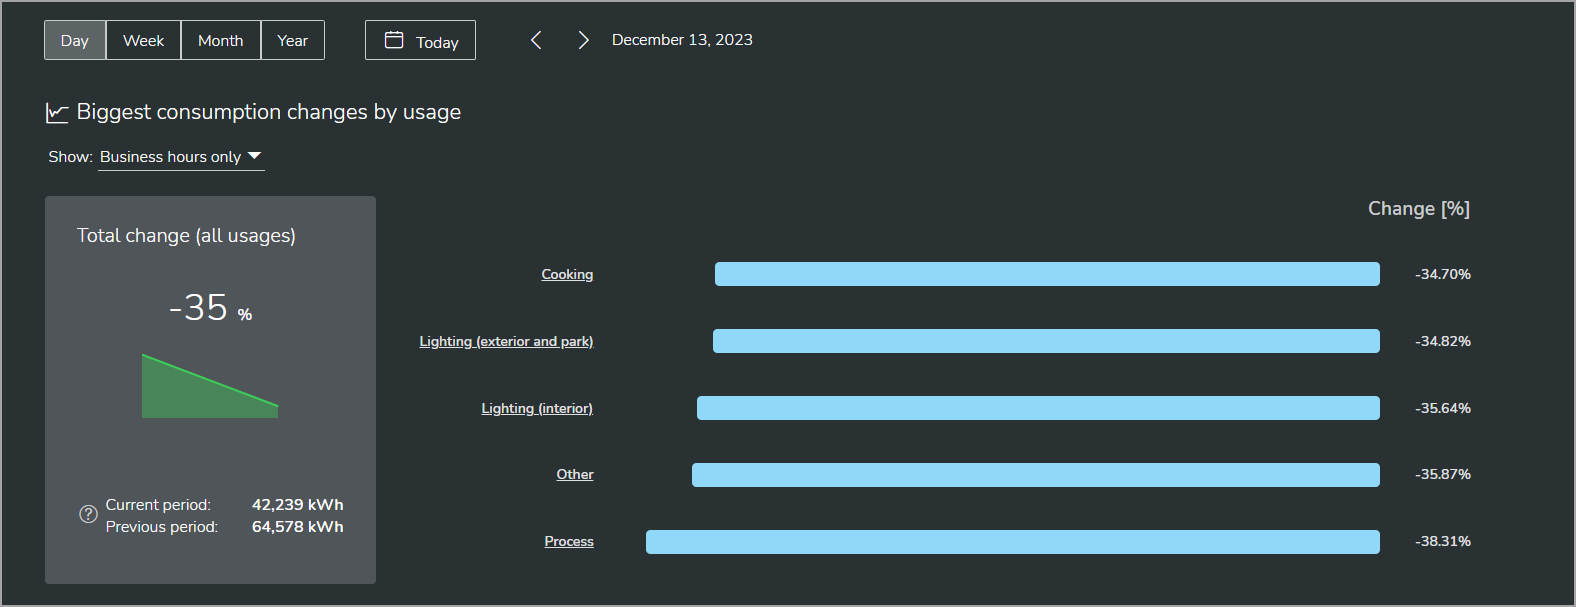
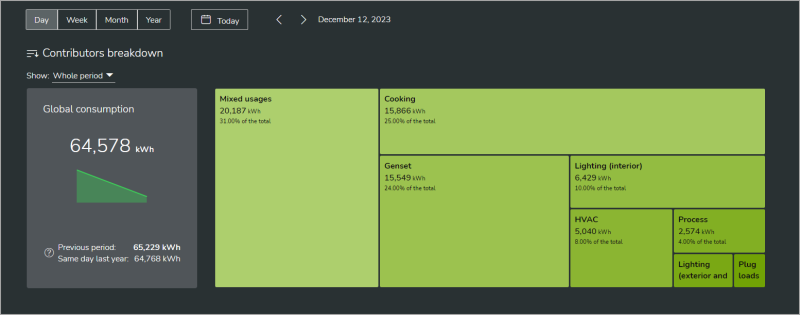
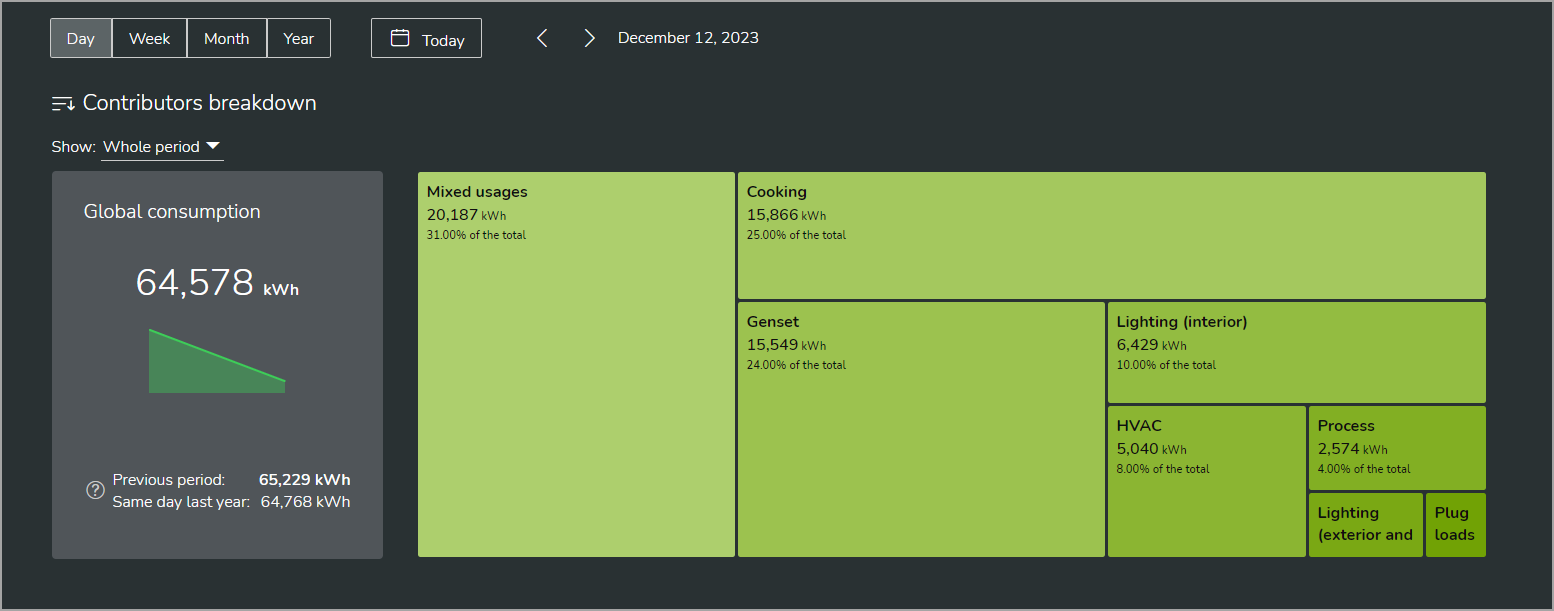
This display shows the biggest period over period changes in energy consumption. For organizations with multiple sites, it shows consumption by site, for organizations with a single site, it shows consumption by energy usage type.
For single site, energy usage type displays, you can view the consumption changes for the whole selected time period, for business hours only, or for closed hours only.
Examples (shown in dark mode):
Multi-site organization
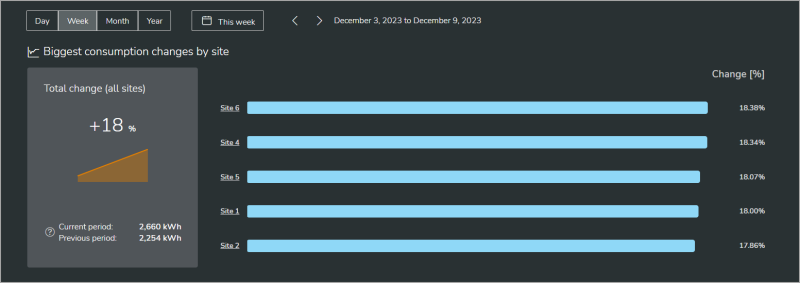
Single-site organization
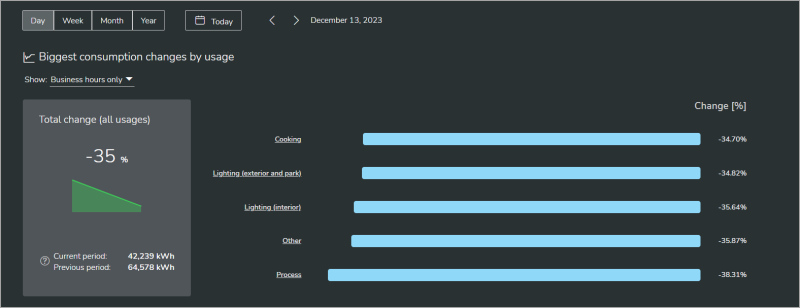
Multi-site organization

Single-site organization
This display compares energy consumption. For organizations with multiple sites, it shows a comparison by site, for organizations with a single site, it shows a comparison by energy usage type.
For multi-site comparisons, you can view actual consumption or consumption normalized by floor area, cooling degree days (CDD), heating degree days (HDD), or both CDD + HDD.
For single site, energy usage type displays, you can view consumption for the entire selected time period, for business hours only, or for closed hours only.
Examples (shown in dark mode):
Multi-site organization
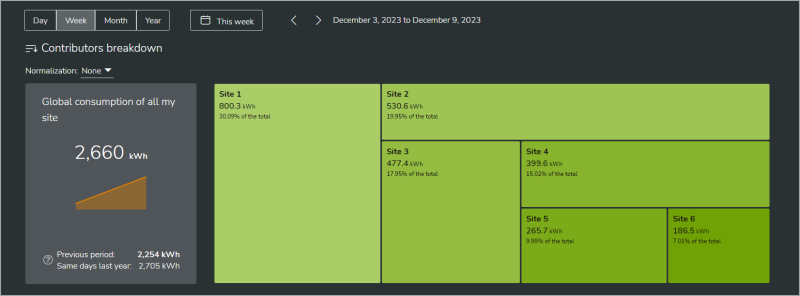
Single-site organization
Multi-site organization

Single-site organization
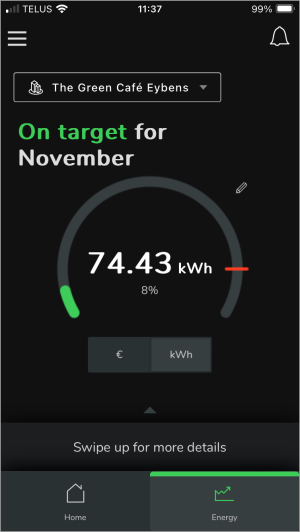
This display shows the monthly energy consumption for a site, compared to its targets. To set the month for the display, select the month, or any day or week in that month, in the date range selector on the Home page.
Examples (shown in dark mode):
![]()
![]()
Inbox
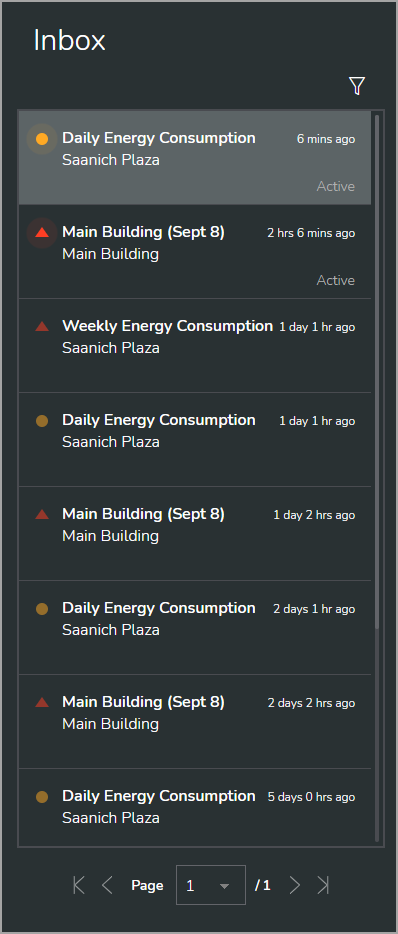
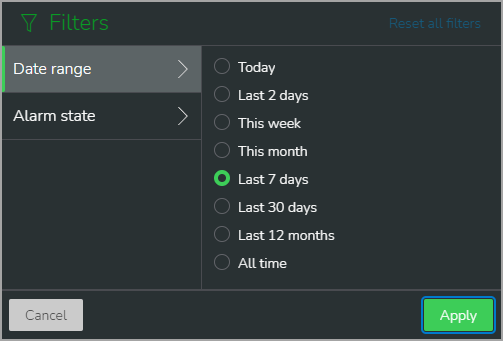
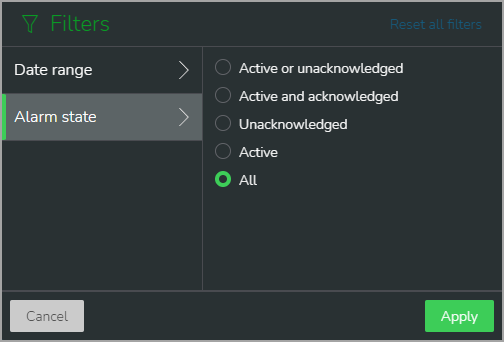
This display shows a list of alarms for the entire organization. The notification settings in Energy Hub determine which alarms are shown. For information on notification settings, see Notification settings. Use the alarm list filter (funnel icon above the alarm list) to filter the list based on date or alarm state.
Examples (shown in dark mode):
Alarm list

Alarm list filter


Alarm list
Alarm list filter
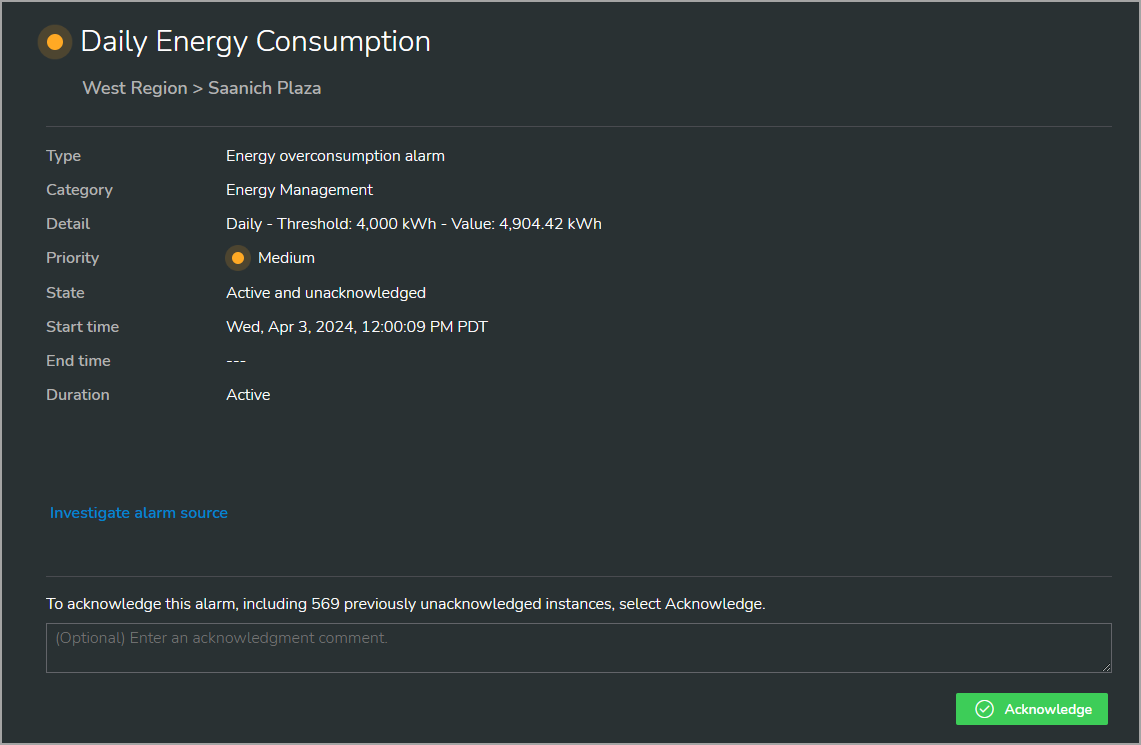
This display shows details for the alarm selected in the alarm list. Select the investigate alarm source link in the details display to open the location, equipment, or device that generated the alarm in Investigate. Select Acknowledge, to acknowledge the alarm and enter an optional comment.
Example (shown in dark mode):

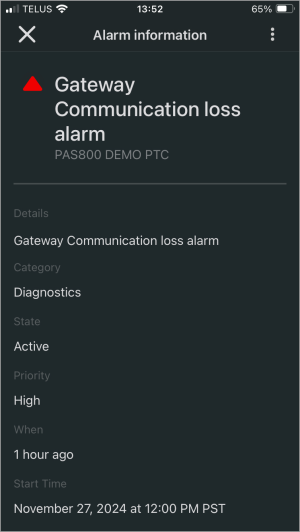
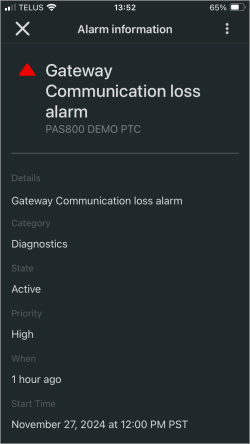
This display shows details for the alarm selected in the alarm list.
Example (shown in dark mode):
|
|
Investigate
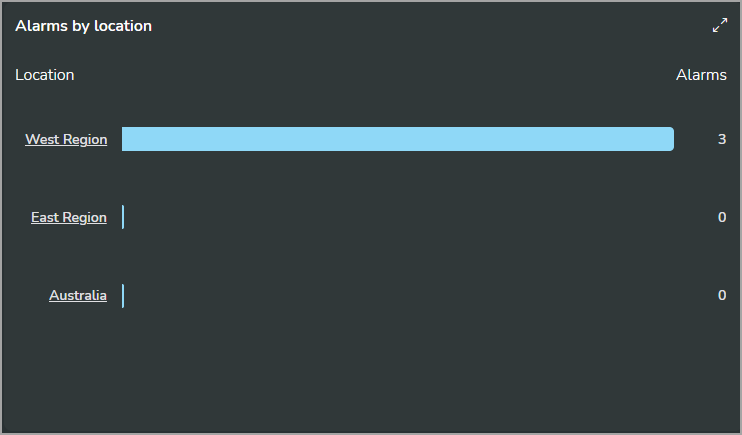
This display shows the number of alarms for the child locations of the selected location. The chart is ordered by alarm count, with the highest alarm count at the top.
NOTE: This display shows a maximum of 10 locations.
TIP: Select the arrows icon in the top right corner to maximize the display.
Example (shown in dark mode):
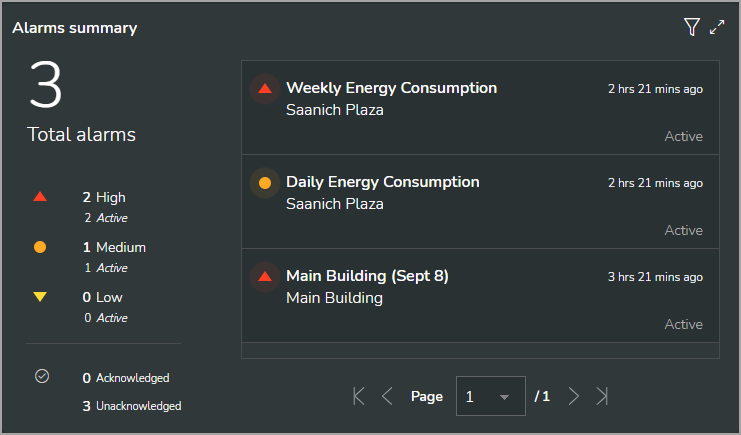
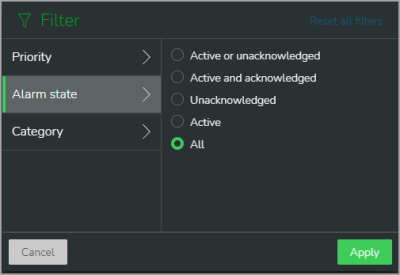
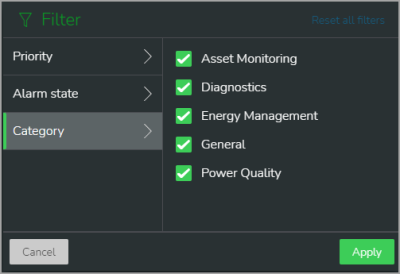
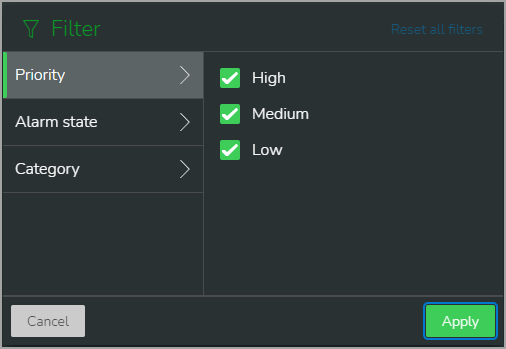
This display shows alarms for the location, equipment, or device selected in the organization tree. The alarm information includes an alarms list, alarm counts and alarm status. Select an alarm from the list to see alarm details. Use the alarms filter (funnel icon) to filter the list based on alarm priority, alarm state, or alarm category.
TIP: Select the arrows icon in the top right corner to maximize the display.
Examples (shown in dark mode):
Alarms summary
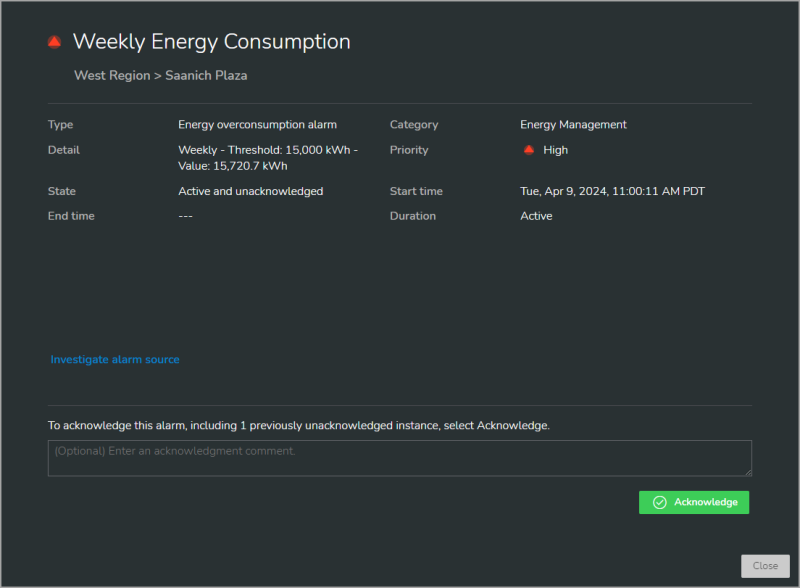
Alarm details
Details for the alarm selected from the alarm list. Select the investigate alarm source link in the details display to open the location, equipment, or device that generated the alarm. Select Acknowledge, to acknowledge the alarm and enter an optional comment.
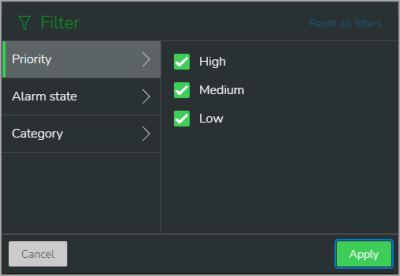
Alarm list filter
Alarms summary
Alarm details
Details for the alarm selected from the alarm list. Select the investigate alarm source link in the details display to open the location, equipment, or device that generated the alarm. Select Acknowledge, to acknowledge the alarm and enter an optional comment.

Alarm list filter


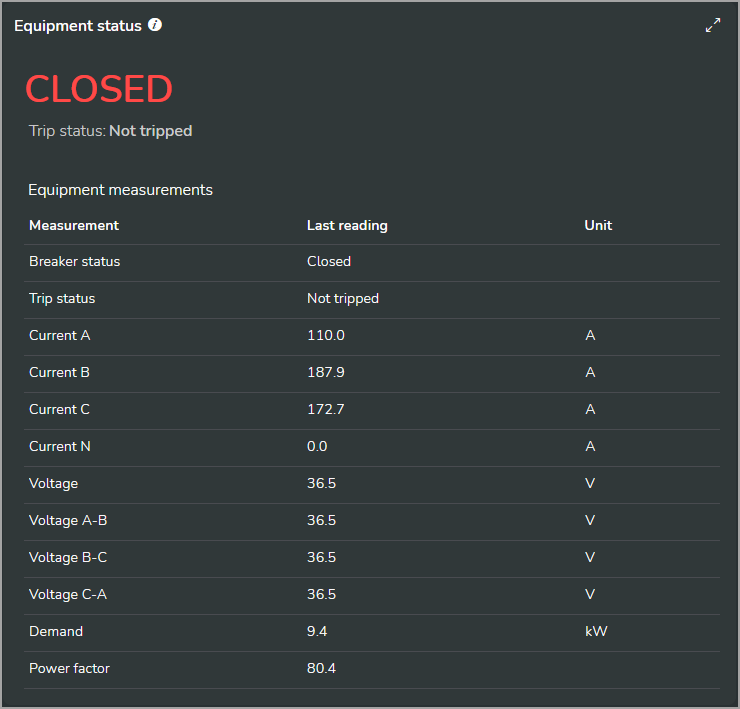
IMPORTANT: The data displayed is not in real-time. It shows the latest logged data for the equipment or monitoring device. Updates occur every 10 minutes.
NOTE: Consumption data from pulse output devices (like water or gas meters) is shown as interval data, not cumulative totals. The interval depends on the gateway’s data logging settings and typically ranges from 5 to 15 minutes.
This display shows power system or commodities data for the selected equipment or monitoring device. The type of equipment and monitoring device that are providing the data determines which data is available.
TIP: Select the arrows icon in the top right corner to maximize the display.
Example (shown in dark mode):

IMPORTANT: The data displayed is not in real-time. It shows the latest logged data for the equipment or monitoring device. Updates occur every 10 minutes.
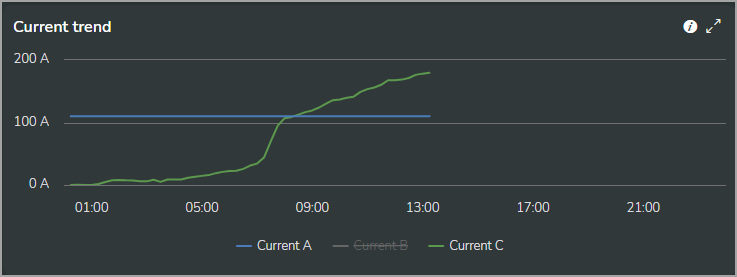
This display shows power system data trends for common measurements, such as voltage, current, power factor, demand, power, energy, frequency, THDi, and THDv. The type of equipment and monitoring device that is providing the data determines which data is available.
NOTE: The display can show up to 20,000 data points, so the time range that can be displayed depends on the data logging frequency.
- To hide or show a series in the chart, select it in the chart legend.
- Hover the pointer over the display to see related information.
- Hover over the i-icon to see the specific measurements that are used.
- Drag the pointer over the chart to zoom.
- Select the arrows icon in the top right corner to maximize the display.
Examples (shown in dark mode):
Current trend for three phase currents
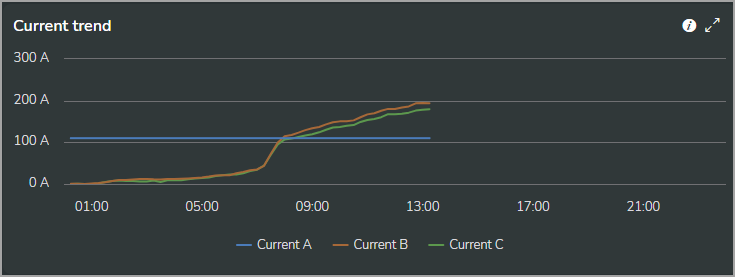
Current trend with current on phase B hidden
Current trend for three phase currents
Current trend with current on phase B hidden
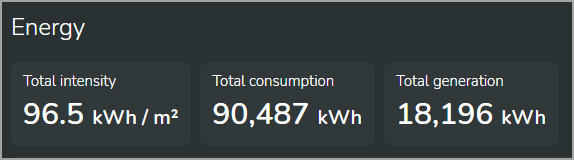
Data tiles show numeric data, such as totals or peaks. They can be used in connection with a chart display or standalone.
Example (shown in dark mode):
This display shows electric power demand and peak demand. Each column in the chart shows the peak demand for the corresponding time interval. An arrow shows the peak for the selected date range.
- The display shows active power demand (kW) or apparent power demand (kVA), depending on the Energy mode setting for the selected location.
- This display shows power data if demand data is not available.
- Hover the pointer over the display to see related information.
- Drag the pointer over the chart to zoom.
- Select the arrows icon in the top right corner to maximize the display.
Example (shown in dark mode):
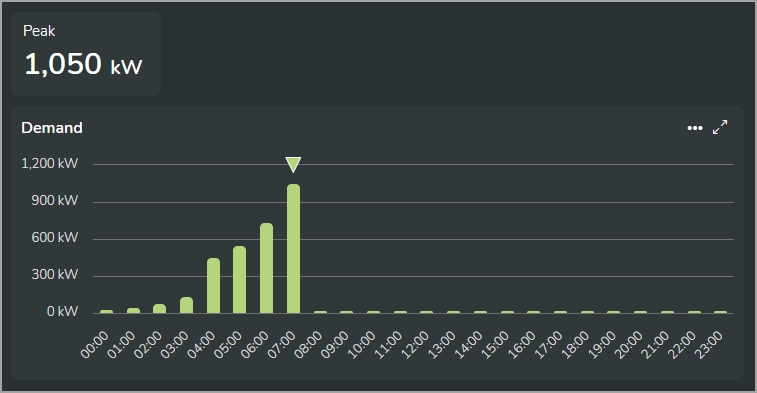
NOTE: The time range for a column in the chart includes the end point and excludes the starting point. For example, in an hourly column chart, a column labeled 08:00 includes measurements taken after 08:00 up to those taken at 09:00.
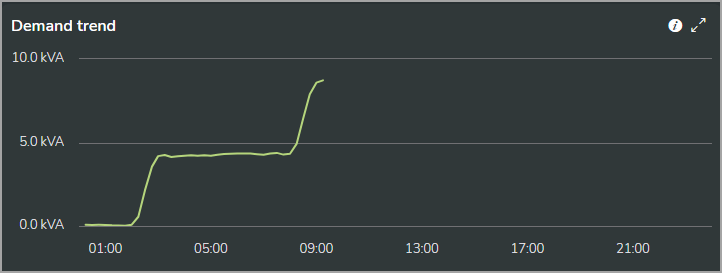
This display shows the electric power demand trend.
IMPORTANT: The data displayed is not in real-time. It shows the latest logged data for the equipment or monitoring device. Updates occur every 10 minutes.
- The display shows active power demand (kW) or apparent power demand (kVA), depending on the Energy mode setting for the selected location.
- This display shows power data if demand data is not available.
- The display can show up to 20,000 data points, so the time range that can be displayed depends on the data logging frequency.
- Hover the pointer over the display to see related information.
- Hover over the i-icon to see the specific measurements that are used.
- Drag the pointer over the chart to zoom.
- Select the arrows icon in the top right corner to maximize the display.
Example (shown in dark mode):
This display shows energy consumption. For locations with on-site generation, the display includes energy generation.
NOTE: The display shows active energy (kWh) or apparent energy (kVAh), depending on the Energy mode setting for the selected location.
- To hide or show a series in the chart, select it in the chart legend.
- Hover the pointer over the display to see related information.
- Drag the pointer over the chart to zoom.
- Select the arrows icon in the top right corner to maximize the display.
Examples (shown in dark mode):
Location without on-site generation
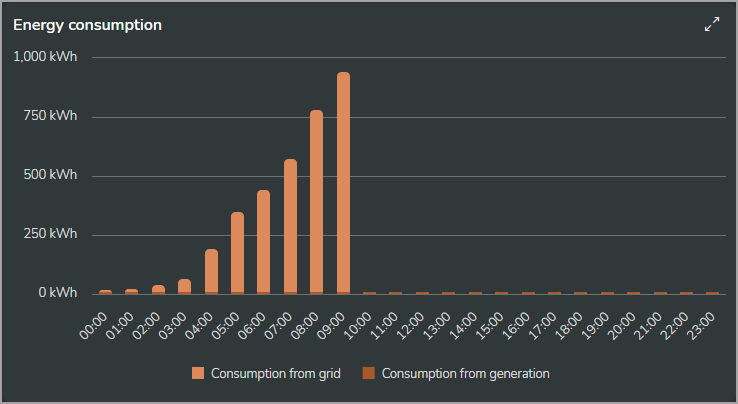
Location with on-site generation
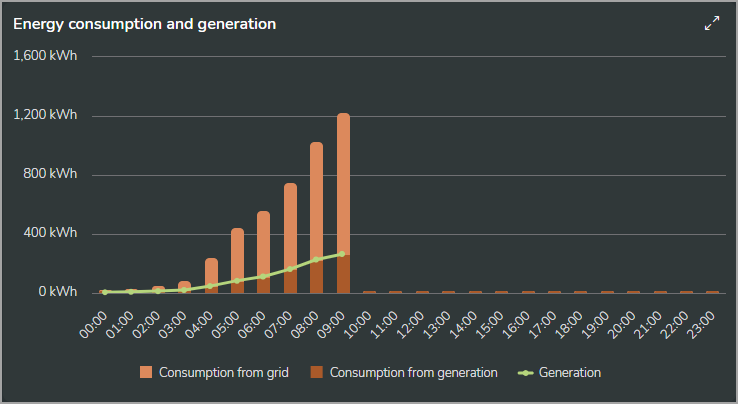
Location without on-site generation
Location with on-site generation
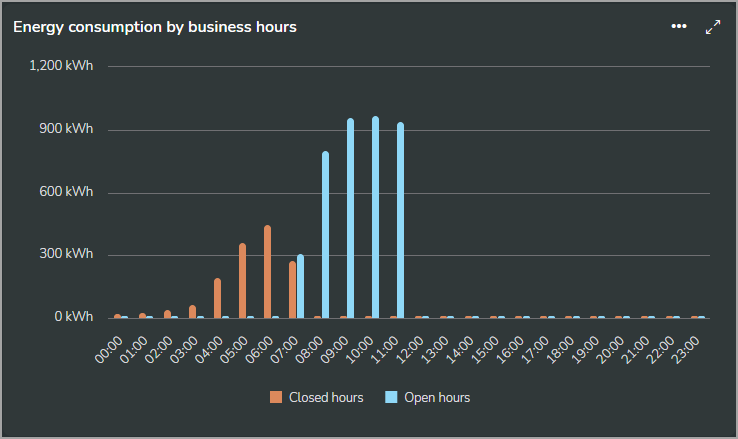
NOTE: The time range for a column in the chart includes the end point and excludes the starting point. For example, in an hourly column chart, a column labeled 08:00 includes measurements taken after 08:00 up to those taken at 09:00.
This display shows energy consumption by business hours (open/closed). Select the options menu (three dots) to configure business hours or export the display data as CSV file.
NOTE: The display shows active energy (kWh) or apparent energy (kVAh), depending on the Energy mode setting for the selected location.
- To hide or show a series in the chart, select it in the chart legend.
- Hover the pointer over the display to see related information.
- Select the arrows icon in the top right corner to maximize the display.
Example (shown in dark mode):
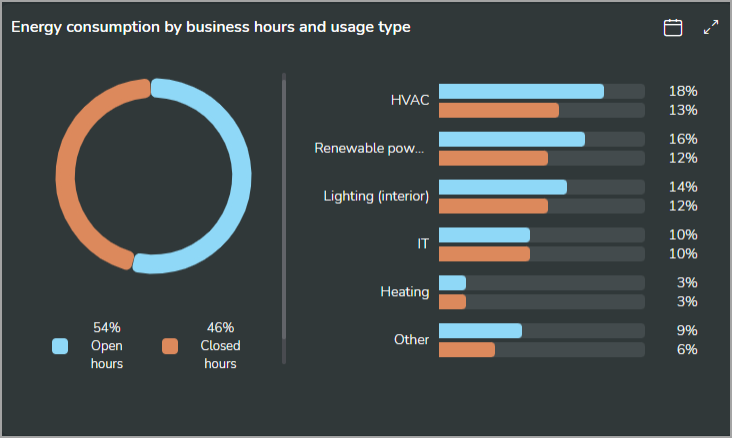
NOTE: The time range for a column in the chart includes the end point and excludes the starting point. For example, in an hourly column chart, a column labeled 08:00 includes measurements taken after 08:00 up to those taken at 09:00.
This display shows energy consumption by business hours (open/closed) and usage. Select the calendar icon in the top right corner of the display to configure business hours .
NOTE: The display shows active energy (kWh) or apparent energy (kVAh), depending on the Energy mode setting for the selected location.
- Hover the pointer over the display to see related information.
- Select the arrows icon in the top right corner to maximize the display.
Example (shown in dark mode):

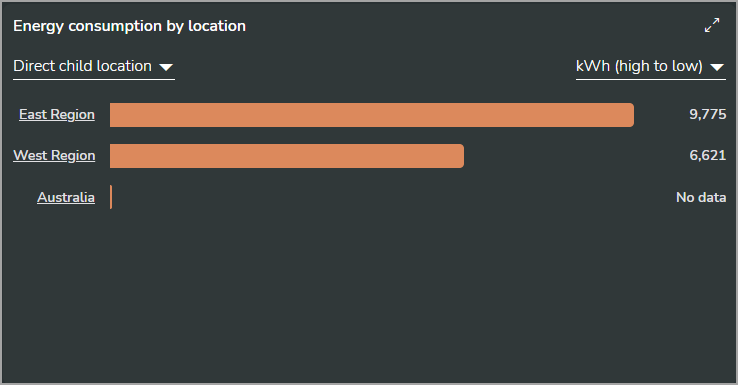
This display shows energy consumption for the child locations of the selected location. You can select the child location type and the ordering of the chart.
- The display shows active energy (kWh) or apparent energy (kVAh), depending on the Energy mode setting for the selected location.
- This display shows a maximum of 10 locations.
- Hover the pointer over the display to see related information.
- Select the arrows icon in the top right corner to maximize the display.
Example (shown in dark mode):
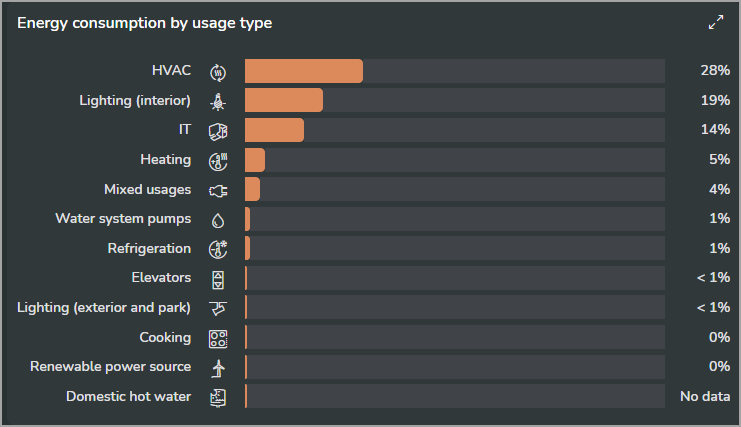
This display shows energy consumption categorized by usage. The chart is ordered by consumption, with the highest consumption at the top.
- The display shows active energy (kWh) or apparent energy (kVAh), depending on the Energy mode setting for the selected location.
- The display shows a maximum of 10 usage types.
- Hover the pointer over the display to see related information.
- Select the arrows icon in the top right corner to maximize the display.
Example (shown in dark mode):
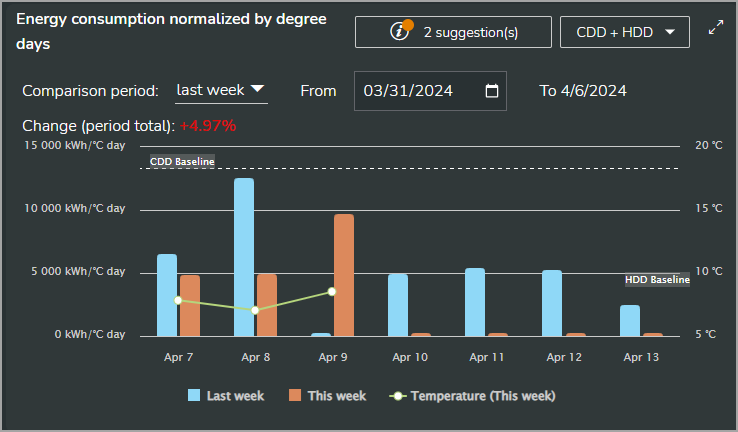
This display shows energy consumption normalized by heating degree days (HDD) and cooling degree days (CDD), based on climate data for your local area. In addition to the energy consumption, the display includes a period-over-period comparison, the average daily outside temperature trend, and the HDD/CDD baselines. The display also shows suggestions on how to get the most value from this analysis.
You can select the following options in the display:
- the date range for a period-over-period comparison
- the normalization reference as HDD + CDD, CDD, or HDD.
NOTE: The display shows active energy (kWh) or apparent energy (kVAh), depending on the Energy mode setting for the selected location.
- To hide or show a series in the chart, select it in the chart legend.
- Hover the pointer over the display to see related information.
- Select the arrows icon in the top right corner to maximize the display.
Example (shown in dark mode):
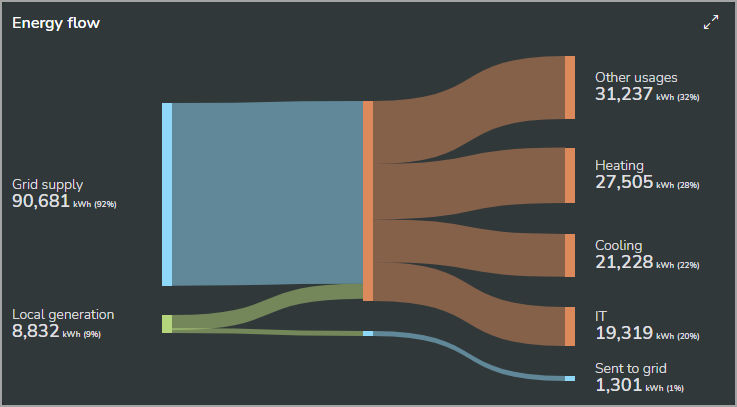
This display shows the energy flow from sources to consumers for your facilities. If there are five or more consumers, the display shows the top three and groups the remaining as Other usages.
NOTE: The display shows active energy (kWh) or apparent energy (kVAh), depending on the Energy mode setting for the selected location.
- Hover the pointer over the display to see related information.
- Select the arrows icon in the top right corner to maximize the display.
Example (shown in dark mode):
This display shows energy consumption per floor area.
NOTE: The display shows active energy (kWh) or apparent energy (kVAh), depending on the Energy mode setting for the selected location.
- Hover the pointer over the display to see related information.
- Drag the pointer over the chart to zoom.
- Select the arrows icon in the top right corner to maximize the display.
Example (shown in dark mode):
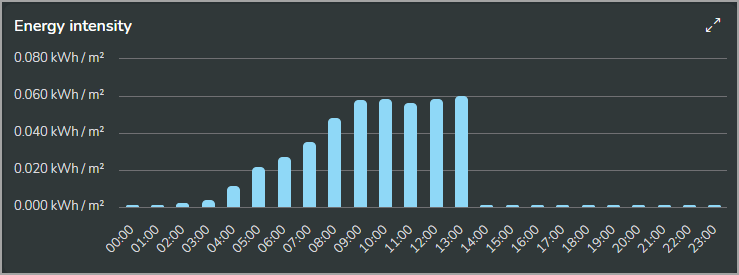
NOTE: The time range for a column in the chart includes the end point and excludes the starting point. For example, in an hourly column chart, a column labeled 08:00 includes measurements taken after 08:00 up to those taken at 09:00.
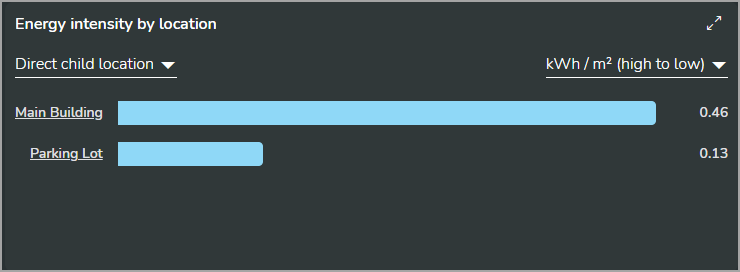
This display shows energy consumption per floor area for the child locations of the selected location. You can select the child location type and the ordering of the chart.
- The display shows active energy (kWh) or apparent energy (kVAh), depending on the Energy mode setting for the selected location.
- This display shows a maximum of 10 locations.
- Hover the pointer over the display to see related information.
- Select the arrows icon in the top right corner to maximize the display.
Example (shown in dark mode):
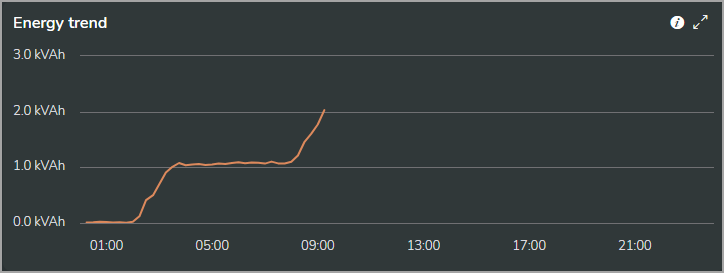
This display shows the electric energy consumption trend.
IMPORTANT: The data displayed is not in real-time. It shows the latest logged data for the equipment or monitoring device. Updates occur every 10 minutes.
- The display shows active power demand (kW) or apparent power demand (kVA), depending on the Energy mode setting for the selected location.
- The display can show up to 20,000 data points, so the time range that can be displayed depends on the data logging frequency.
- Hover the pointer over the display to see related information.
- Hover over the i-icon to see the specific measurements that are used.
- Drag the pointer over the chart to zoom.
- Select the arrows icon in the top right corner to maximize the display.
Example (shown in dark mode):
This display shows fuel gas consumption.
- Hover the pointer over the display to see related information.
- Drag the pointer over the chart to zoom.
- Select the arrows icon in the top right corner to maximize the display.
Example (shown in dark mode):
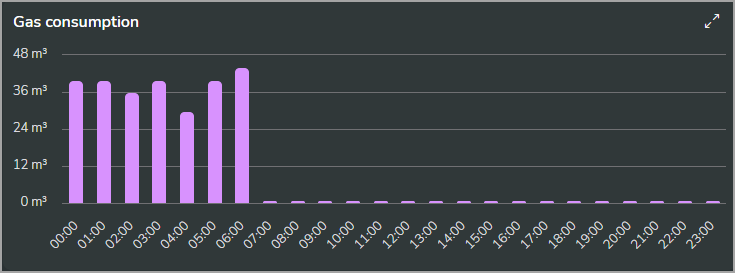
NOTE: The time range for a column in the chart includes the end point and excludes the starting point. For example, in an hourly column chart, a column labeled 08:00 includes measurements taken after 08:00 up to those taken at 09:00.
This display shows water consumption.
- Hover the pointer over the display to see related information.
- Drag the pointer over the chart to zoom.
- Select the arrows icon in the top right corner to maximize the display.
Example (shown in dark mode):
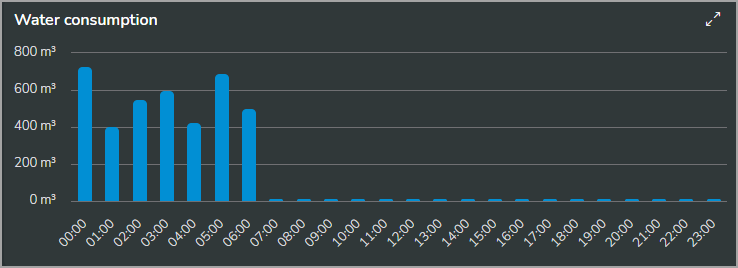
NOTE: The time range for a column in the chart includes the end point and excludes the starting point. For example, in an hourly column chart, a column labeled 08:00 includes measurements taken after 08:00 up to those taken at 09:00.
This display shows water consumption per floor area.
- Hover the pointer over the display to see related information.
- Drag the pointer over the chart to zoom.
- Select the arrows icon in the top right corner to maximize the display.
Example (shown in dark mode):
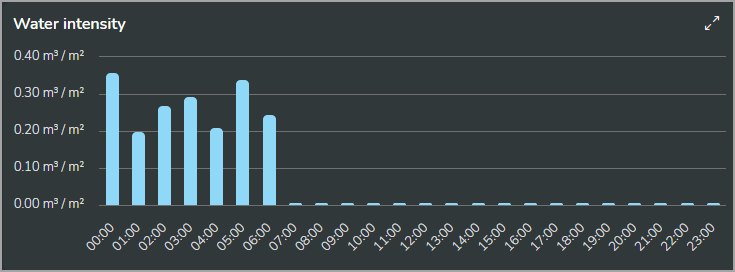
NOTE: The time range for a column in the chart includes the end point and excludes the starting point. For example, in an hourly column chart, a column labeled 08:00 includes measurements taken after 08:00 up to those taken at 09:00.
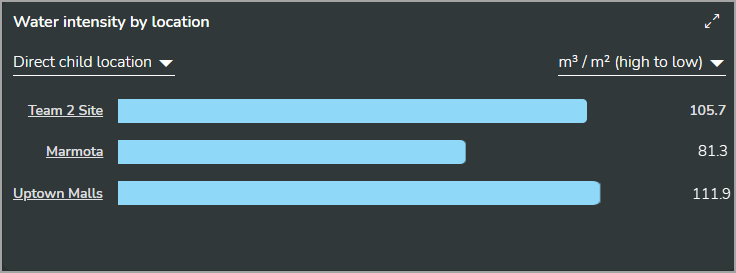
This display shows water consumption per floor area for the child locations of the selected location. You can select the child location type and the ordering of the chart.
NOTE: This display shows a maximum of 10 locations.
- Hover the pointer over the display to see related information.
- Select the arrows icon in the top right corner to maximize the display.
Example (shown in dark mode):
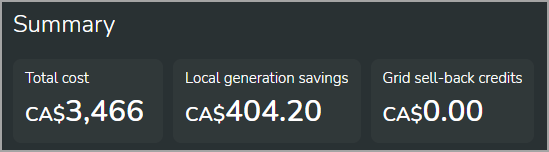
Data tiles show numeric data, such as total cost or total savings. They can be used in connection with a chart display or standalone.
Example (shown in dark mode):
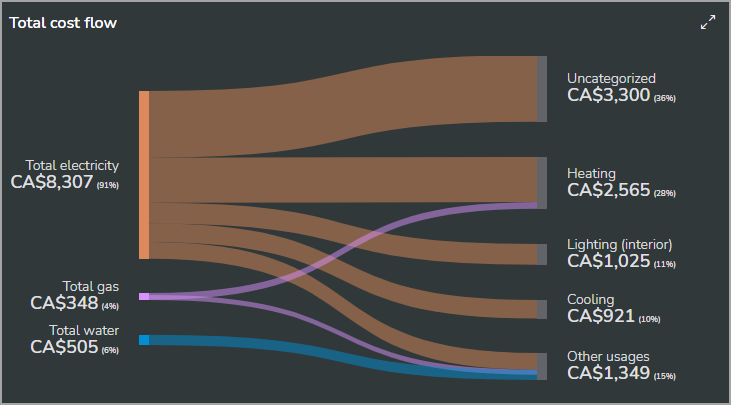
This display shows the cost flow from sources to consumers for all energy and commodity types (electricity, fuel gas, water). If there are five or more consumers, the display shows the top three and groups the remaining as Other usages.
- Hover the pointer over the display to see related information.
- Select the arrows icon in the top right corner to maximize the display.
Example (shown in dark mode):
NOTE: Costs are rounded to whole numbers in the cost flow diagram if any displayed cost exceeds 500.
This display shows electric energy cost. For locations with on-site generation, the display includes savings from energy generation.
- Hover the pointer over the display to see related information.
- Select the arrows icon in the top right corner to maximize the display.
Examples
Daily electricity cost for time-of-use tariff (shown in dark mode):
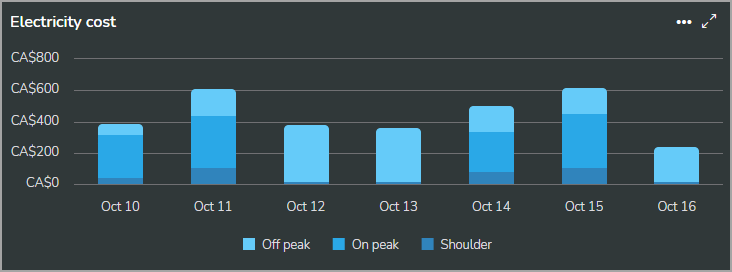
Hourly electricity cost for time-of-use tariff (shown in dark mode):
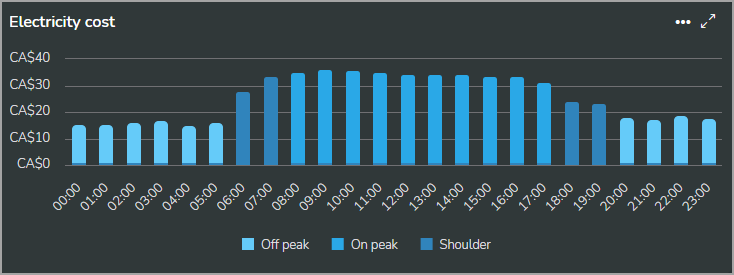
Daily electricity cost for time-of-use tariff (shown in dark mode):
Hourly electricity cost for time-of-use tariff (shown in dark mode):
This display shows water consumption cost. Select the options menu (three dots) to export the display data as CSV file.
NOTE: Water cost is based on water volume, not on water heat energy.
- Hover the pointer over the display to see related information.
- Drag the pointer over the chart to zoom.
- Select the arrows icon in the top right corner to maximize the display.
Example (shown in dark mode):
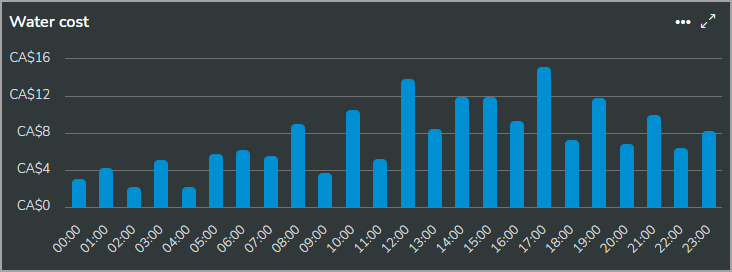
NOTE: The time range for a column in the chart includes the end point and excludes the starting point. For example, in an hourly column chart, a column labeled 08:00 includes measurements taken after 08:00 up to those taken at 09:00.
This display shows fuel gas consumption cost. Select the options menu (three dots) to export the display data as CSV file.
NOTE: Gas cost is based on gas volume, not on gas energy content.
- Hover the pointer over the display to see related information.
- Drag the pointer over the chart to zoom.
- Select the arrows icon in the top right corner to maximize the display.
Example (shown in dark mode):
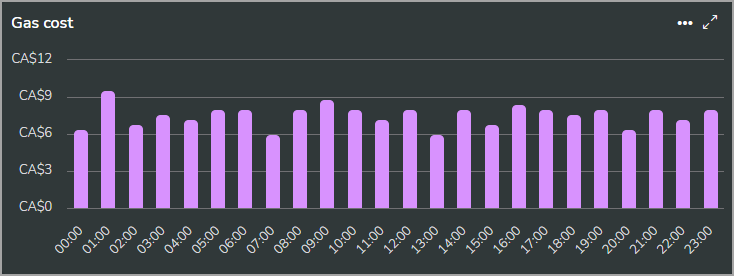
NOTE: The time range for a column in the chart includes the end point and excludes the starting point. For example, in an hourly column chart, a column labeled 08:00 includes measurements taken after 08:00 up to those taken at 09:00.
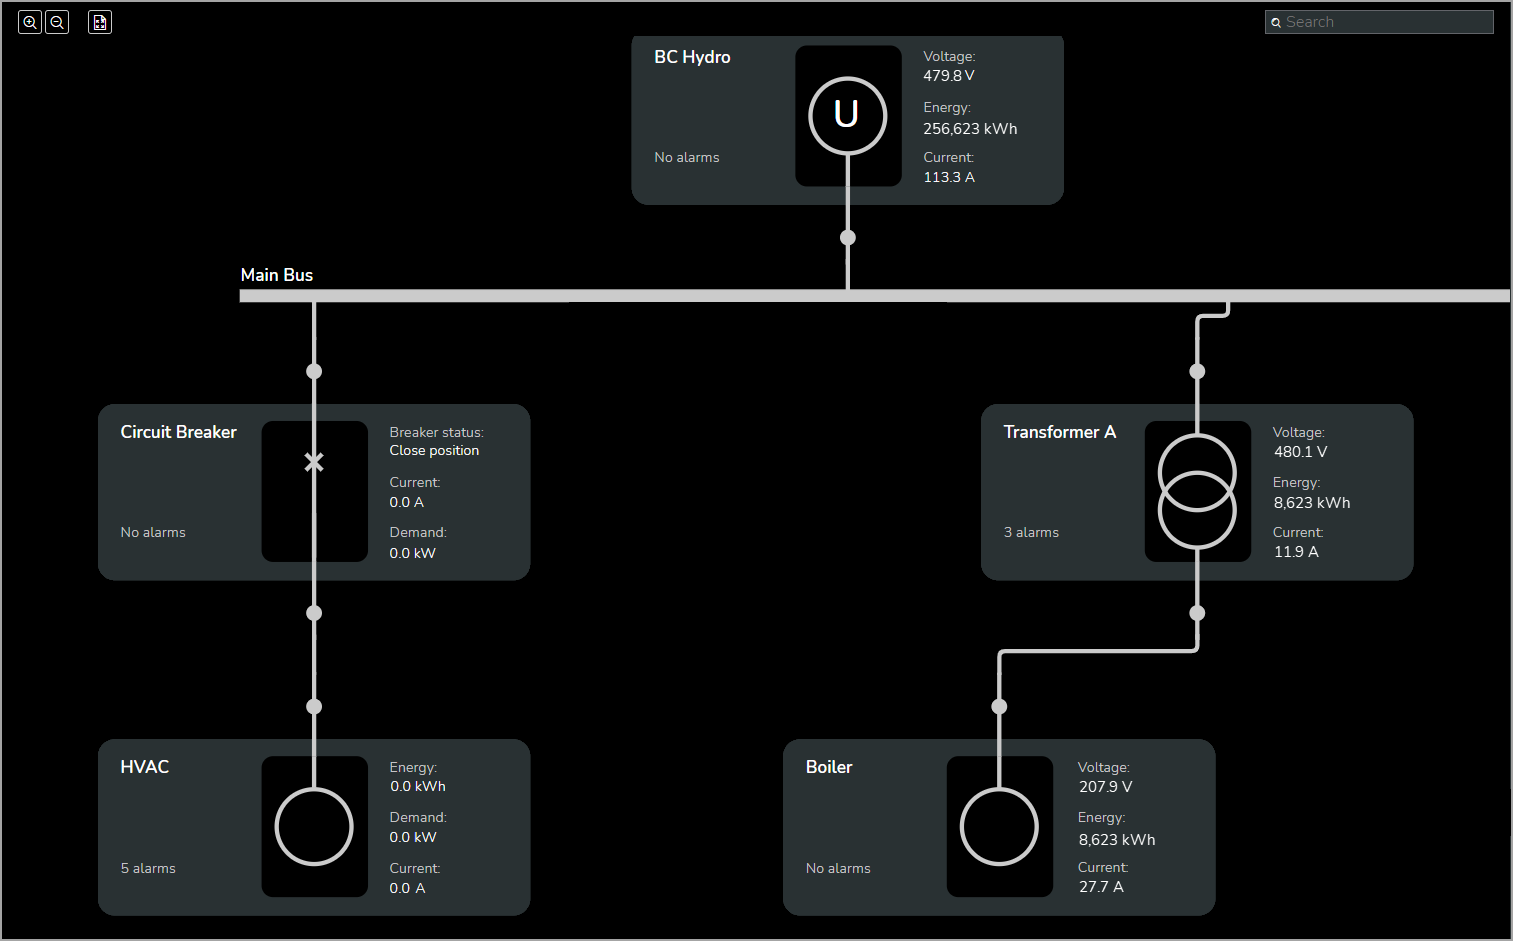
This display shows an electrical single-line diagram.
IMPORTANT: The data displayed is not in real-time. It shows the latest logged data for the equipment or monitoring device. Updates occur every 10 minutes.
TIP: Hover the pointer over the display to see related information.
Examples (shown in dark mode):
Diagram zoomed out
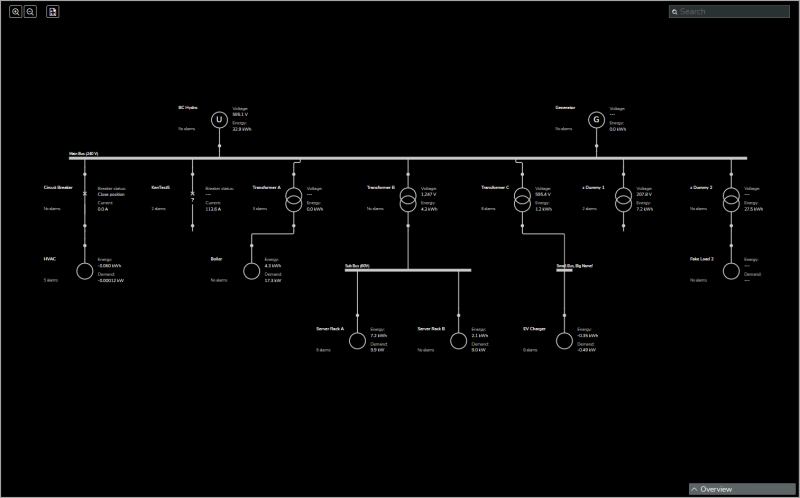
Diagram zoomed in
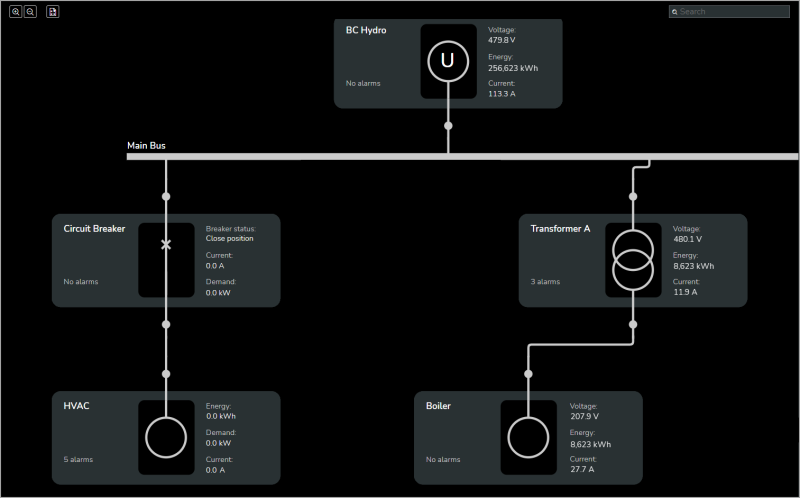
Diagram zoomed out

Diagram zoomed in
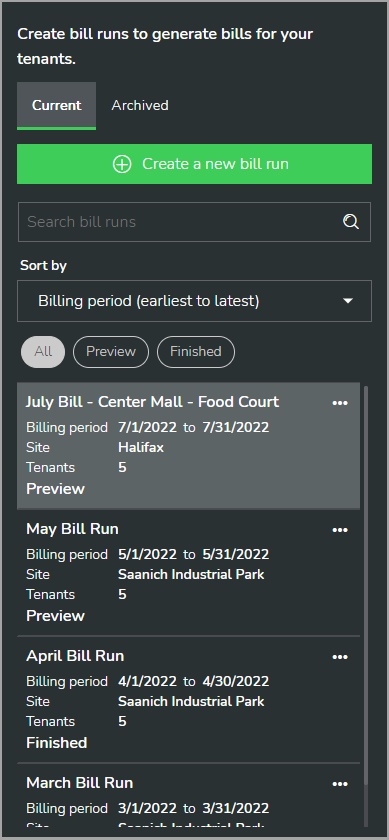
Tenant billing
This display shows the bill runs that have been created in Energy Hub. You can access current and archived bill runs. The display also includes a control to create new bill runs.
Example (shown in dark mode):

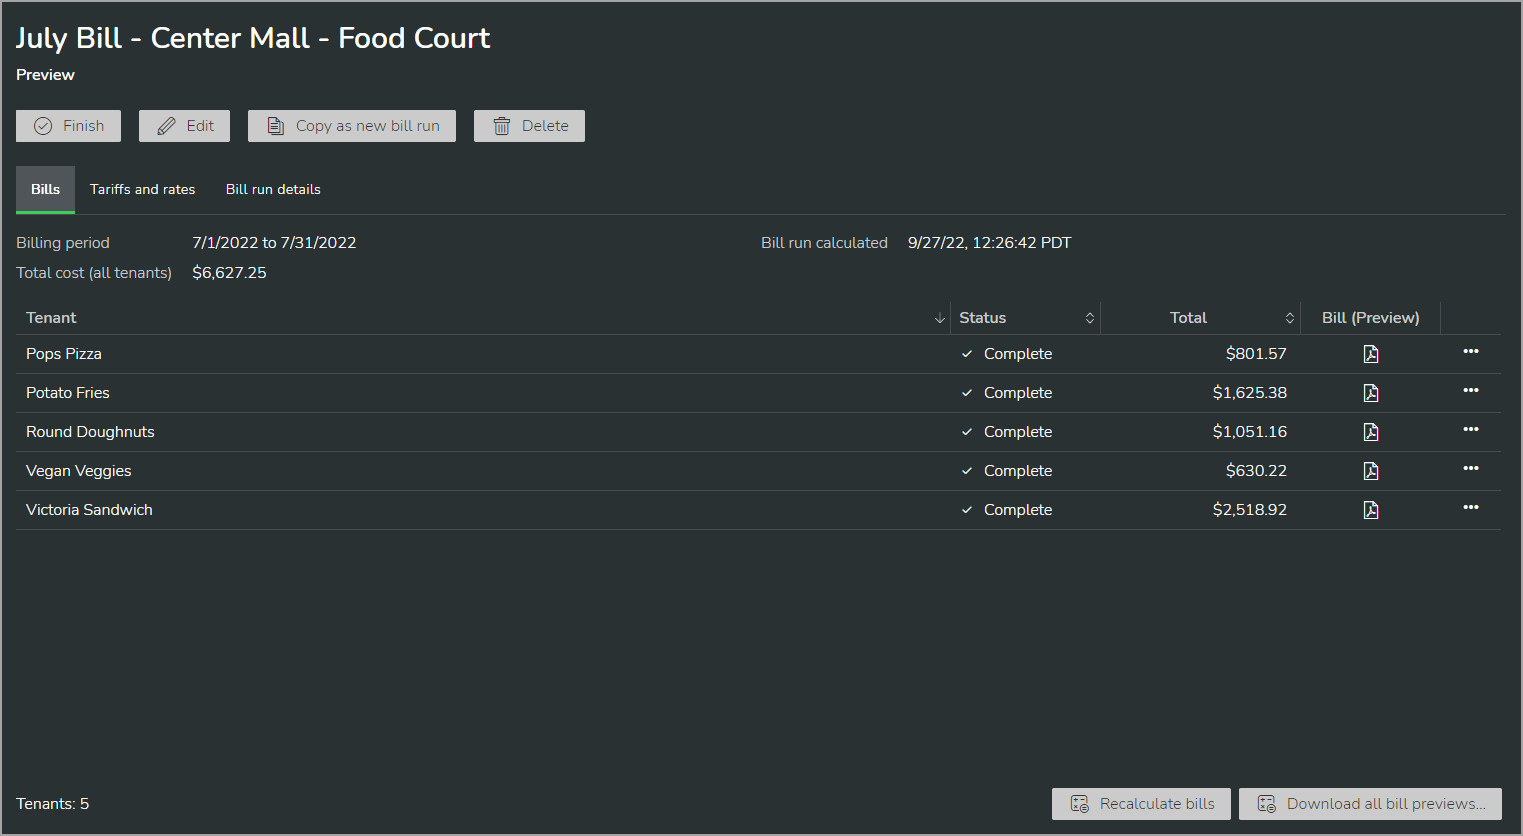
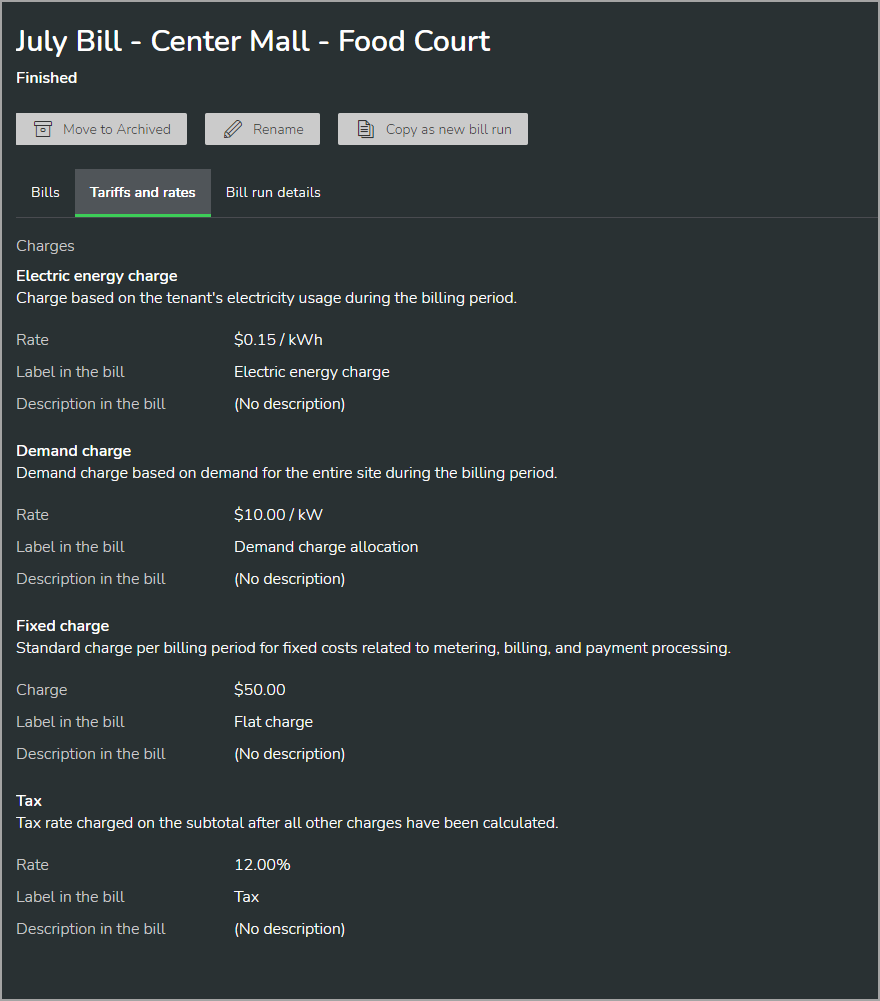
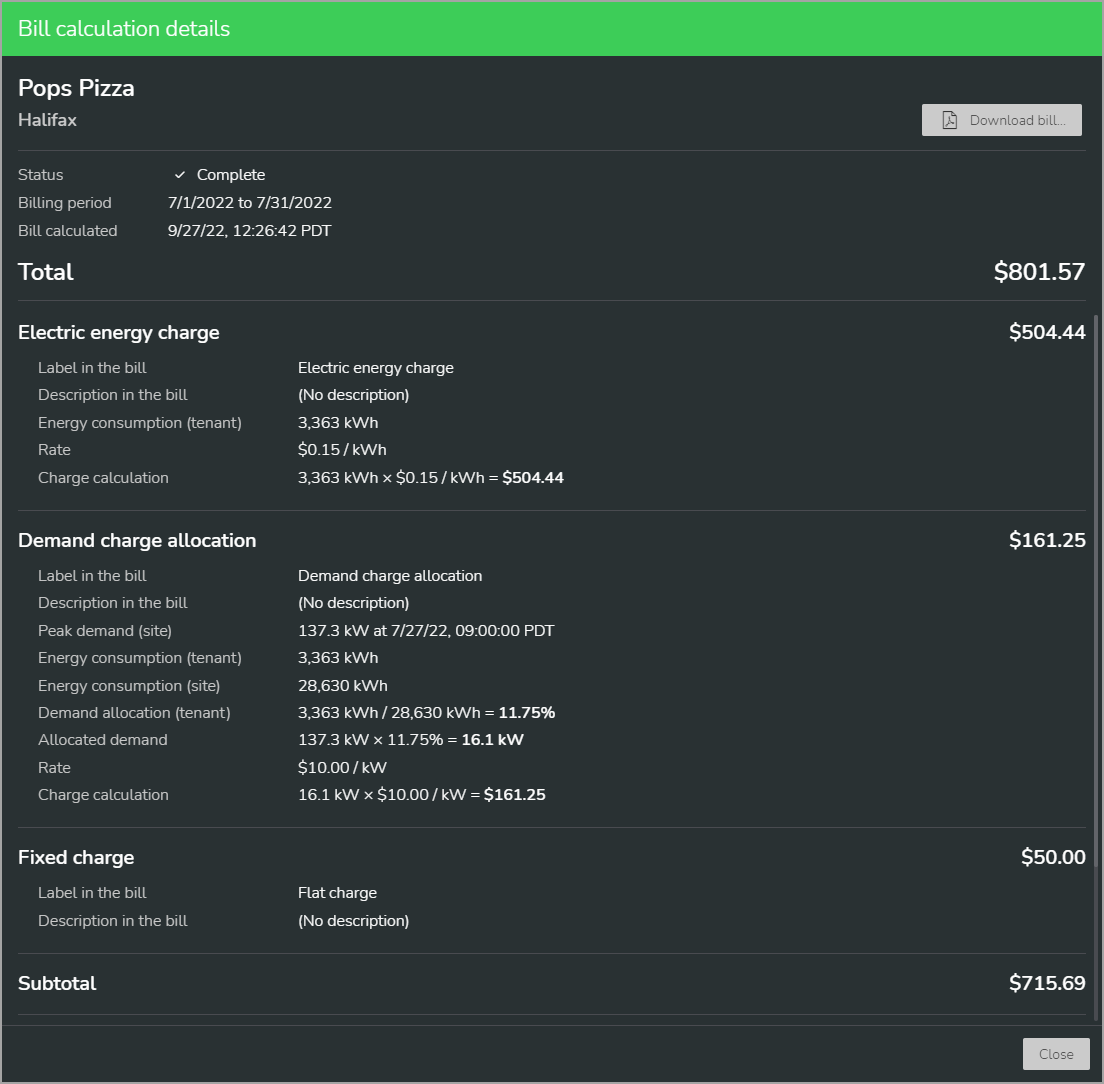
These displays show the bills that are included in a bill run and information related to these bills. The displays also include controls to create and manage bill runs, and to download tenant bills in PDF format.
Examples (shown in dark mode):
Bills included in bill run
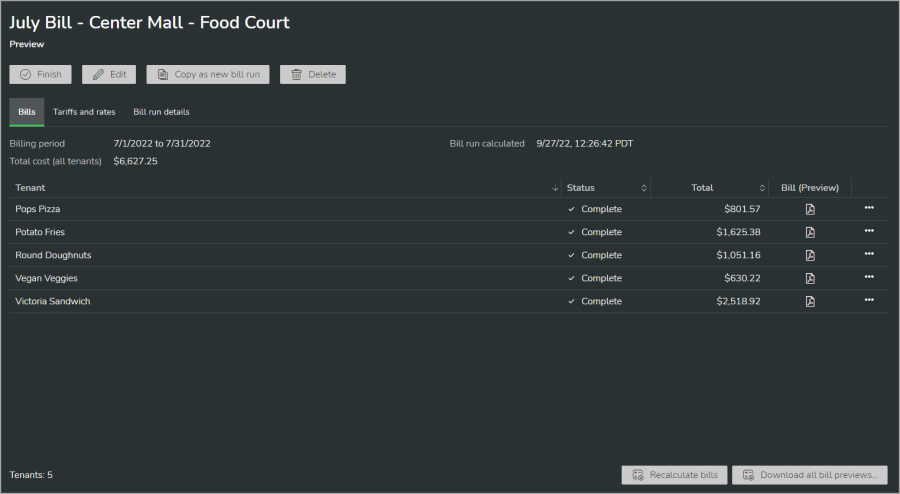
Bill run tariffs and rates
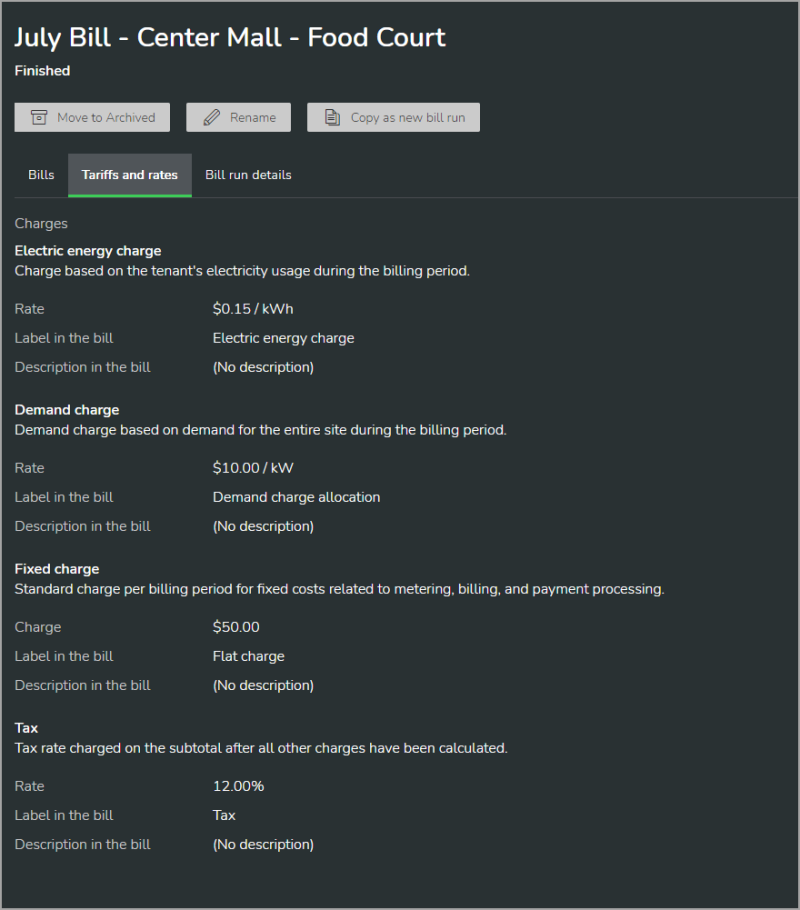
Bills run details
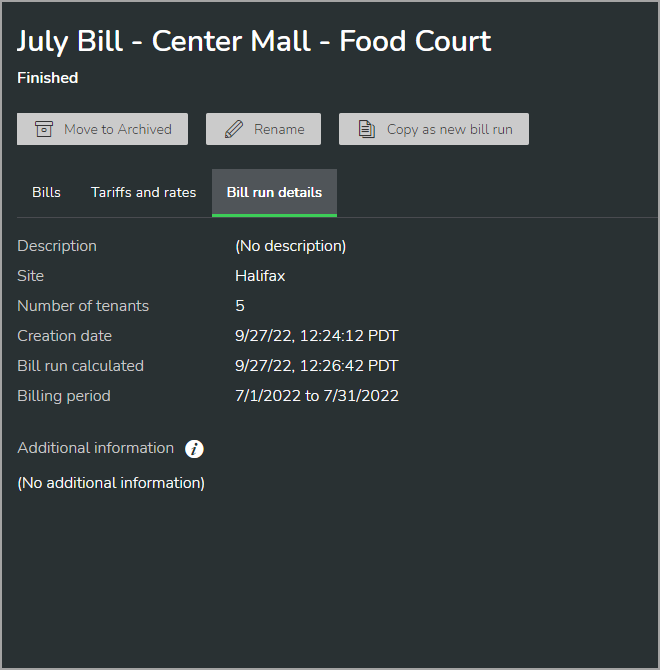
Bill calculation details

Bills included in bill run
Bill run tariffs and rates
Bills run details
Bill calculation details
NABERS
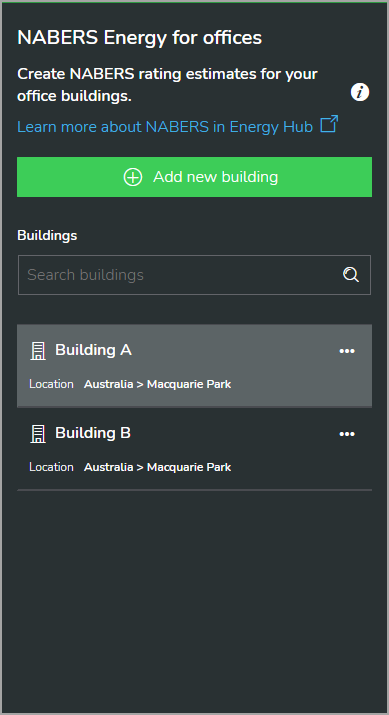
This display shows the buildings that have been added to the NABERS rating functionality in Energy Hub. The display also includes a control to add new buildings.
Example (shown in dark mode):

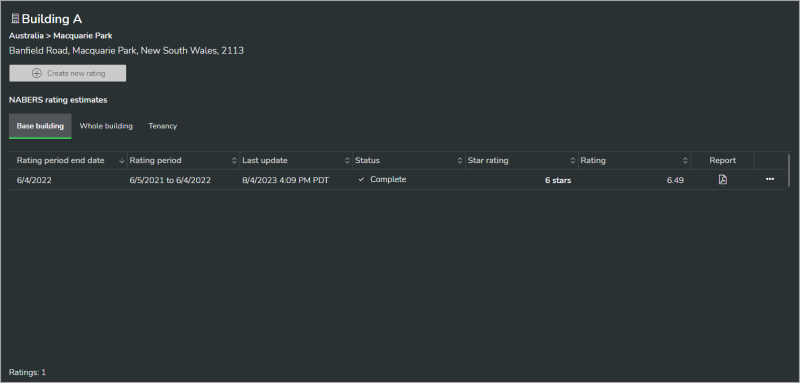
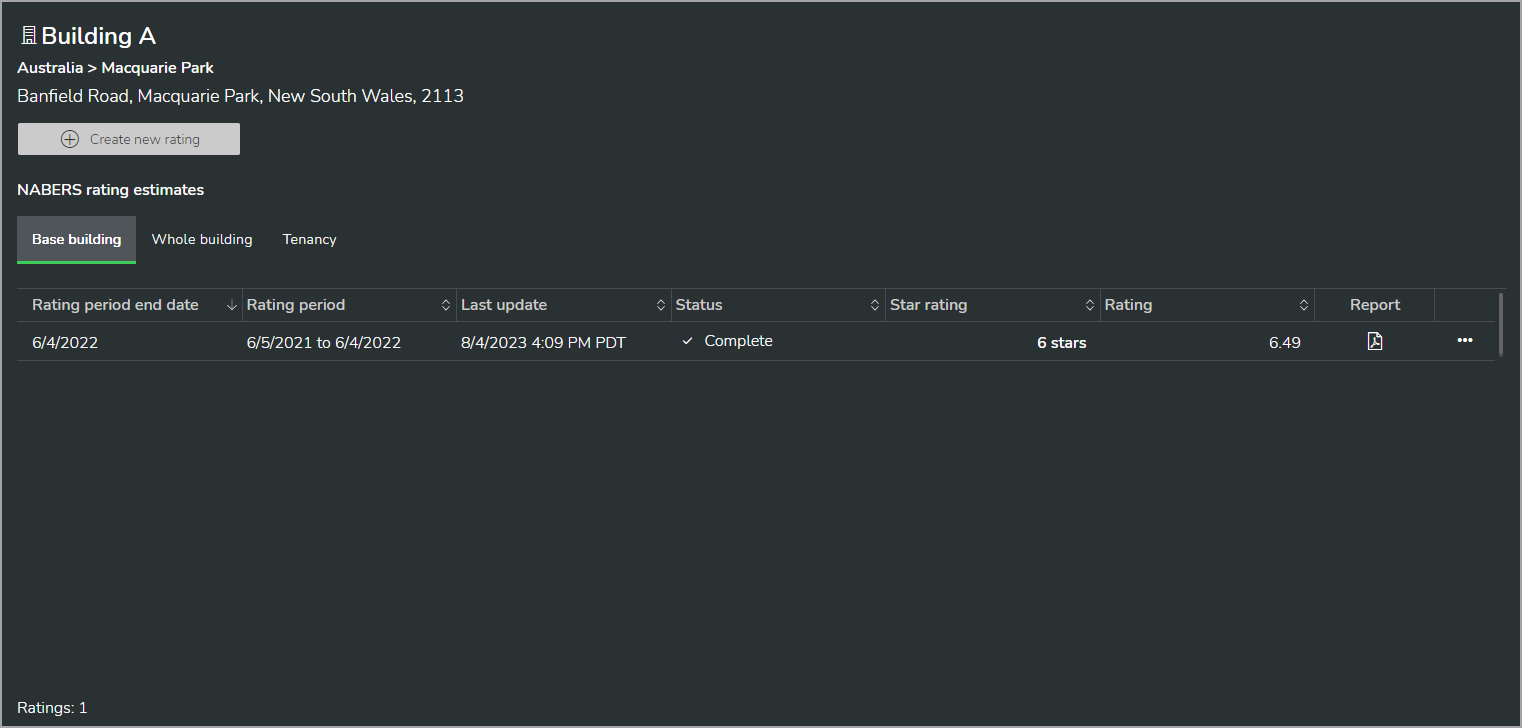
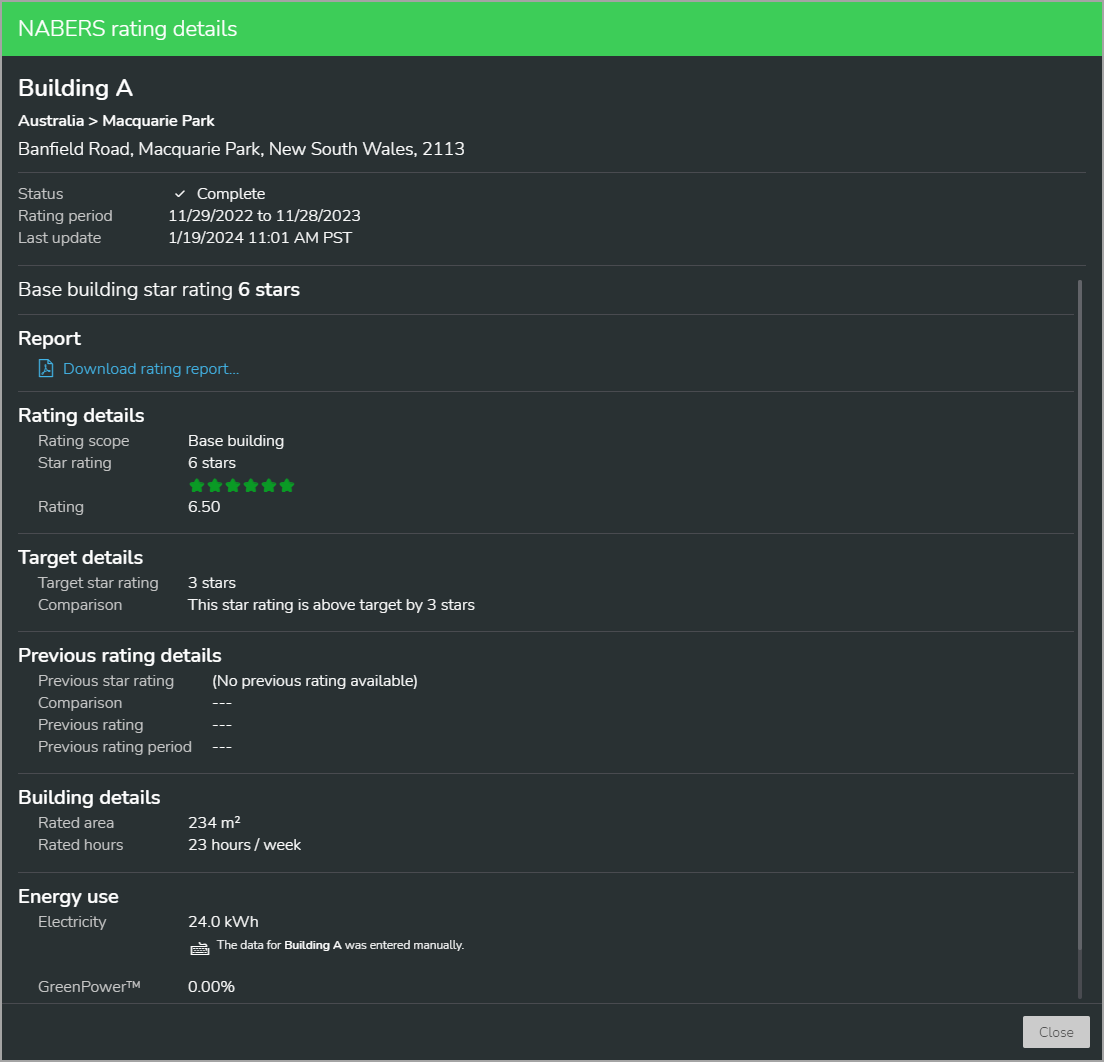
These displays show the rating estimates for a building and rating related information. The displays also include controls to create new ratings, and to download ratings reports in PDF format.
Examples (shown in dark mode):
Building ratings
Rating details

Building ratings
Rating details
[Site Manager mode]
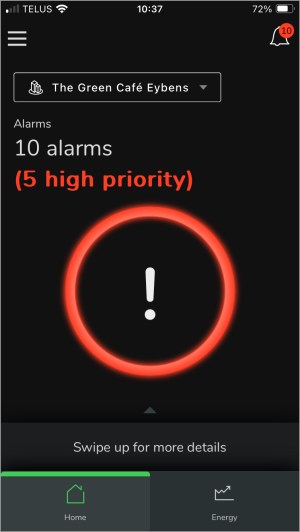
Home
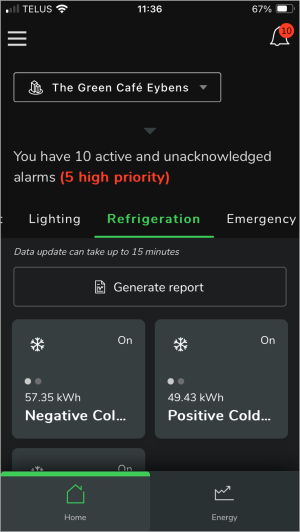
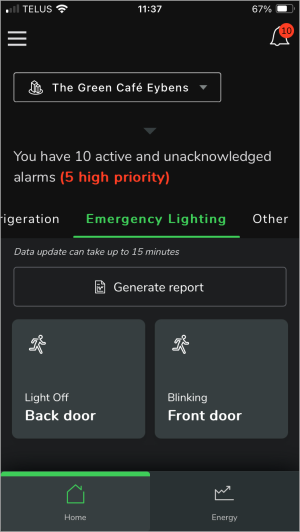
Alarm count shows the number of active, unacknowledged alarms for the selected site.
TIP: Select the alarm count text to view the alarms list with detailed alarm information.
Examples (shown in dark mode):
|
|


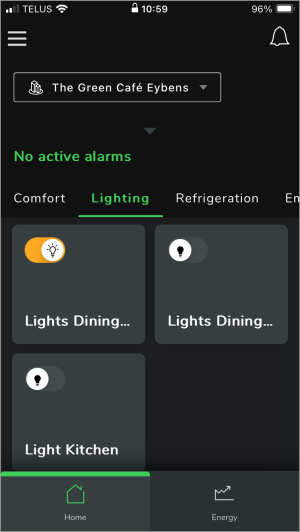
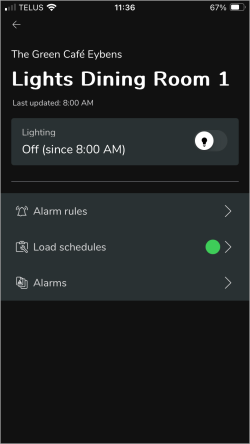
Load on/off status shows if the selected load is turned on or turned off.
Example (shown in dark mode):

|
|

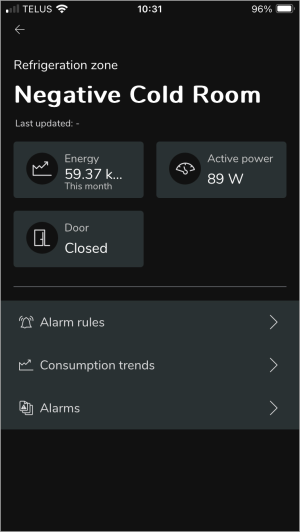
This display shows if the selected refrigeration equipment door is open or closed.
Example (shown in dark mode):
|

|
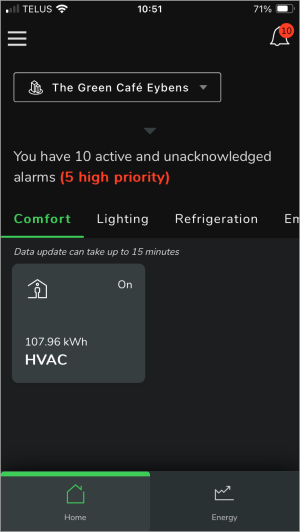
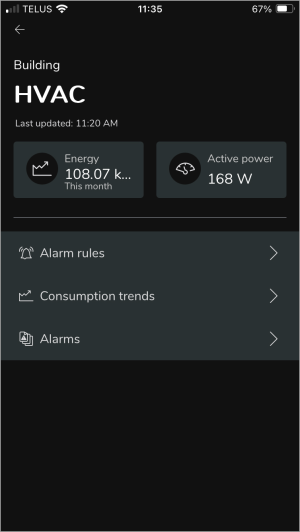
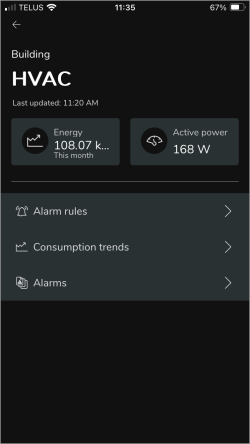
This display shows the power consumption for a selected load.
Example (shown in dark mode):
|
|
With this display you can turn loads on or off.
Example (shown in dark mode):
|

|

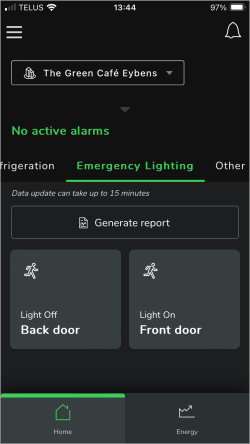
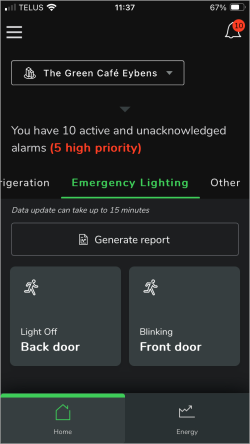
Create refrigeration HACCP reports and emergency lighting test reports.
Examples (shown in dark mode):
|
|

Energy
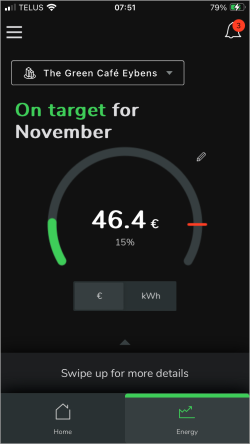
This display shows the monthly energy consumption and cost for a site, compared to its targets.
Example (shown in dark mode):
|

|

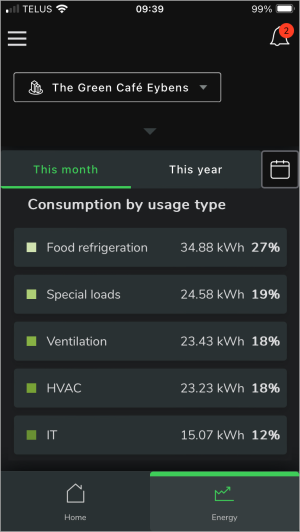
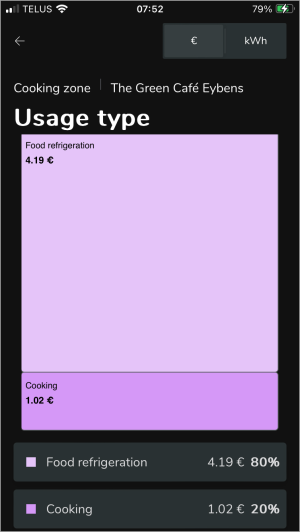
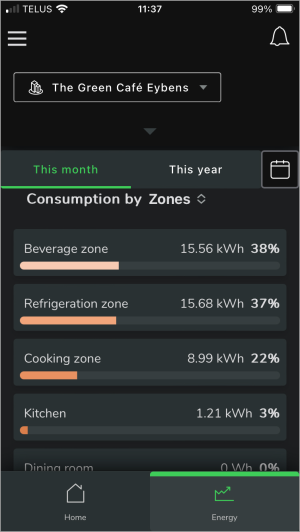
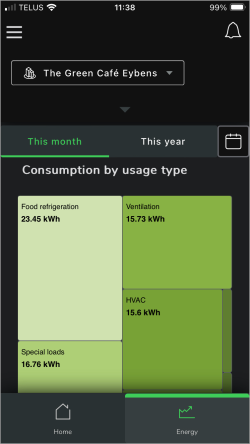
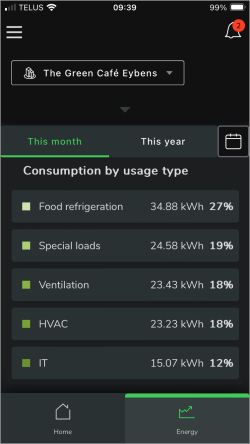
This display compares energy consumption and cost for different usage types and different locations of a selected site.
Examples (shown in dark mode):

|
|
|
|


[Technician mode]
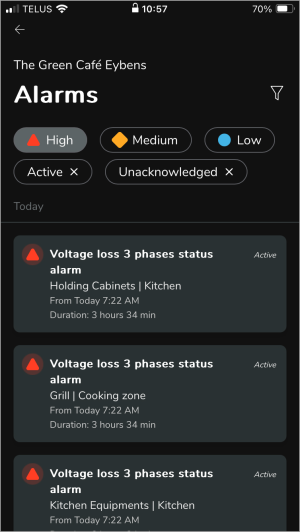
Inbox
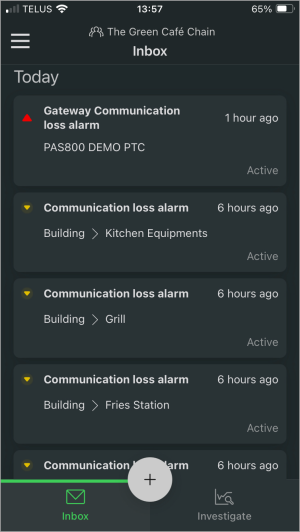
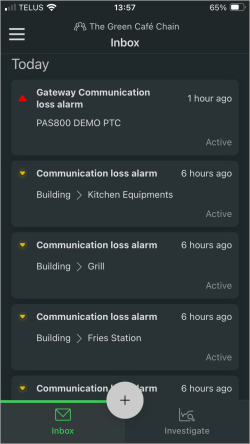
This display shows a list of alarms for the entire organization. The notification settings in Energy Hub determine which alarms are shown. For information on notification settings, see Notification settings.
Examples (shown in dark mode):
|
|
Investigate
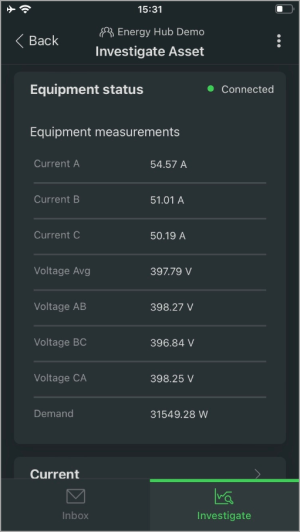
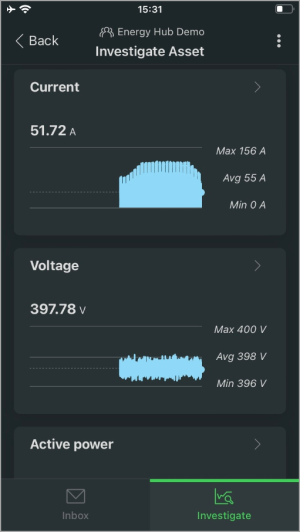
This display shows power system data for the selected equipment or monitoring device. The type of equipment and monitoring device that are providing the data determines which data is available.
IMPORTANT: The data displayed is not in real-time. It shows the latest logged data for the equipment or monitoring device. Updates occur every 10 minutes.
Example (shown in dark mode):
|

|
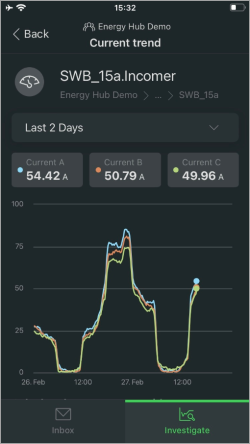
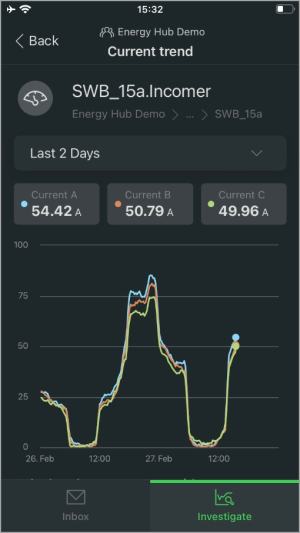
This display shows power system data trends for common measurements, such as voltage, current, power factor, demand, power, energy, frequency, THDi, and THDv. The type of equipment and monitoring device that is providing the data determines which data is available.
IMPORTANT: The data displayed is not in real-time. It shows the latest logged data for the equipment or monitoring device. Updates occur every 10 minutes.
Examples (shown in dark mode):
|
|