Electrical power monitoring
NOTE: The functionality displayed in this topic might not be the same as what you see for your organization. Your Energy Hub feature plan subscription determines what functionality is available for this feature. For feature plan details, see Feature plans.
Overview
Monitor the status of your electrical equipment and your energy infrastructure. Receive alarms and investigate exceptional operating conditions in your facility. Create single-line diagrams of your electrical system to see how system components are connected and to monitor the energy flow in the network. Monitor your electrical panels and switchboards to detect cable overheating.
Features
[Web app and mobile app]
IMPORTANT: The data for this functionality is not real-time. Energy Hub uses the latest logged data from the equipment or monitoring device. Updates occur every 10 minutes.
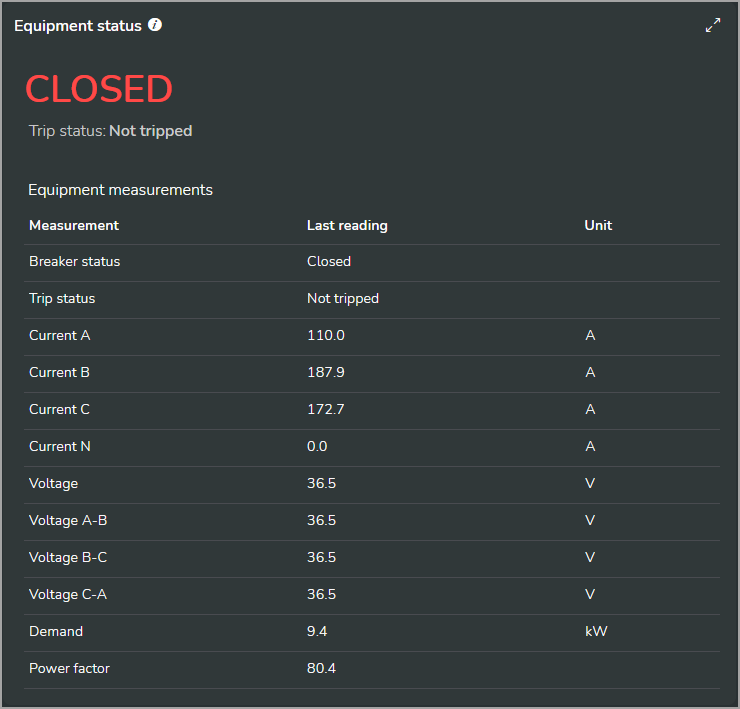
Equipment status shows the latest operational data, such as voltage, current, power, power factor, or circuit breaker status, for electrical loads and equipment. The monitoring devices that are providing the data and the equipment that is being monitored determine the type of data that is available.
Equipment status includes the following data:
- Breaker status
- Breaker trip status
- Current
- Voltage
- Power factor
- Power Demand (active, reactive, apparent)
- Fuel gas volume
- Fuel gas flow
- Water volume
- Water flow
- Air volume
- Air flow
- Heat power (kW)
- Temperature (ambient, equipment)
- Humidity
NOTE: Consumption data from pulse output devices (like water or gas meters) is shown as interval data, not cumulative totals. The interval depends on the gateway’s data logging settings and typically ranges from 5 to 15 minutes.
[Web app]
Energy Hub offers the following software-based alarm types for equipment status monitoring:
- Active power (over/under) alarm
- Current (over/under) alarm
- Voltage (over/under) alarm
- Power factor (under) alarm
NOTE: Your feature plan subscription, the monitoring device types, and the device configurations determine the types of alarms you can have for your organization. For information on which alarm types are available for different devices and feature plans, see the alarms reference.
[Mobile app]
There are no software-based alarm types for equipment status in the mobile app.
To learn more about alarming in Energy Hub, see Alarming.
For details on software-based alarms, see Software-based alarms.
For step-by-step instructions on how to configure software-based alarms and manage alarms in general, see alarming and notification tasks.
Prerequisites
Verify that:
- You have an active Energy Hub subscription that includes this feature. For information on subscriptions, see Energy Hub subscriptions.
- Power monitoring devices are installed in your facility to monitor loads such as lighting, air conditioning, plug loads, and other consumers.
- The monitoring devices are connected to communication gateways, for example Site Server or Panel Server, that are sending measurement data to Energy Hub over the internet.
- The communication gateways have been added to your organization in Energy Hub.
Configuration
No configuration is required to see equipment status information.
[Web app]
You can view equipment status in the Asset view in Investigate.
Equipment status (shown in dark mode):

[Mobile app – Technician mode only]
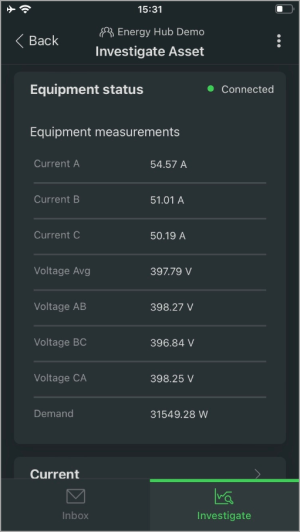
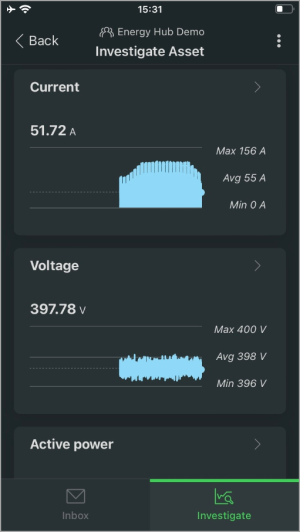
You can view equipment status on the Investigate tab.
Equipment status (shown in dark mode):
|
Equipment status (shown in dark mode):

|
For step-by-step instructions on how to view equipment status, see To view equipment status information.
[Web app]
You can create an equipment status report by printing the data displays in the Asset view in Investigate, or by saving them as a PDF output. CSV export is not available for equipment status displays.
[Mobile app]
There is no reporting for equipment status in the mobile app.
For step-by-step instructions on how to report on energy system data, see reporting tasks.
[Web app and mobile app]
IMPORTANT: The data for this functionality is not real-time. Energy Hub uses the latest logged data from the equipment or monitoring device. Updates occur every 10 minutes.
Trends show graphs of operational data, such as voltage or power factor, for electrical loads and equipment for recent and historical power system conditions. You can view trends for different loads or equipment and different date ranges.
Trends includes the following data:
- Current
- Voltage
- Power factor
- Energy (active, reactive, apparent)
- Power Demand (active, reactive, apparent)
- Fuel gas volume
- Fuel gas flow
- Water volume
- Water flow
- Air volume
- Air flow
- Heat power (kW)
- Heat energy (kWh)
- Current THD
- Voltage THD
- Temperature (ambient, equipment)
- Humidity
There are no software-based alarm types for trends.
To learn more about alarming in Energy Hub, see Alarming.
For details on software-based alarms, see Software-based alarms.
Prerequisites
Verify that:
- You have an active Energy Hub subscription that includes this feature. For information on subscriptions, see Energy Hub subscriptions.
- Power monitoring devices are installed in your facility to monitor loads such as lighting, air conditioning, plug loads, and other consumers.
- The monitoring devices are connected to communication gateways, for example Site Server or Panel Server, that are sending measurement data to Energy Hub over the internet.
- The communication gateways have been added to your organization in Energy Hub.
Configuration
No configuration is required to see trend information.
[Web app]
You can view trends in the Asset view in Investigate.
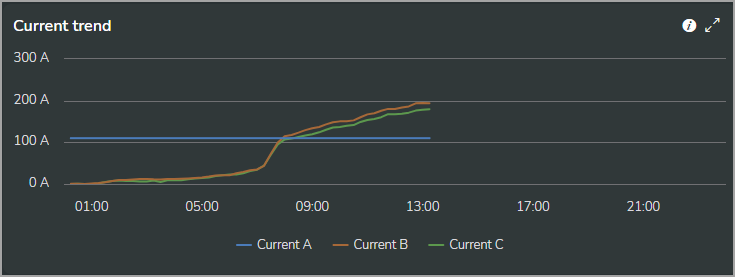
Current trend for three phase currents (shown in dark mode):
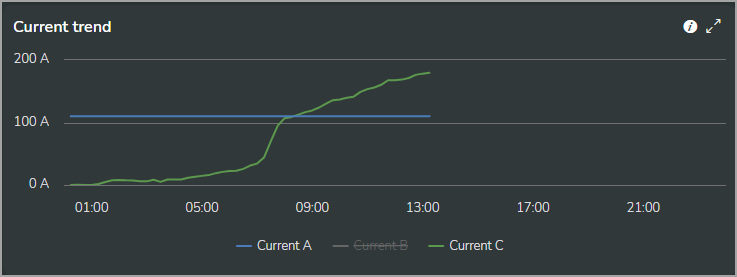
Current trend with current on phase B hidden (shown in dark mode):
Current trend for three phase currents (shown in dark mode):
Current trend with current on phase B hidden (shown in dark mode):
[Mobile app – Technician mode only]
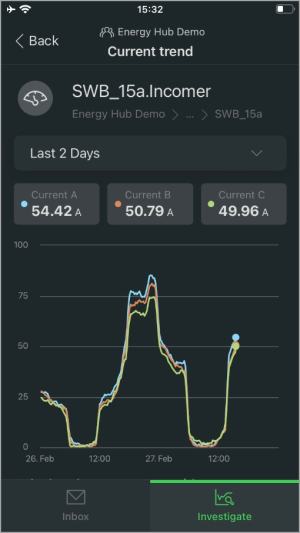
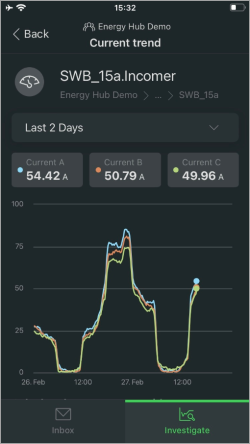
You can view trends on the Investigate tab.
Current and voltage trends (shown in dark mode):
|
|
Current and voltage trends (shown in dark mode):

For step-by-step instructions on how to view trends, see To view power system data trends.
[Web app]
You can create a trends report by printing the data displays in the Energy view in Investigate, or by saving them as a PDF output. You can also export the data that is used in the displays in CSV file format.
[Mobile app]
There is no reporting for trends in the mobile app.
For step-by-step instructions on how to report on energy system data, see reporting tasks.
[Web app only]
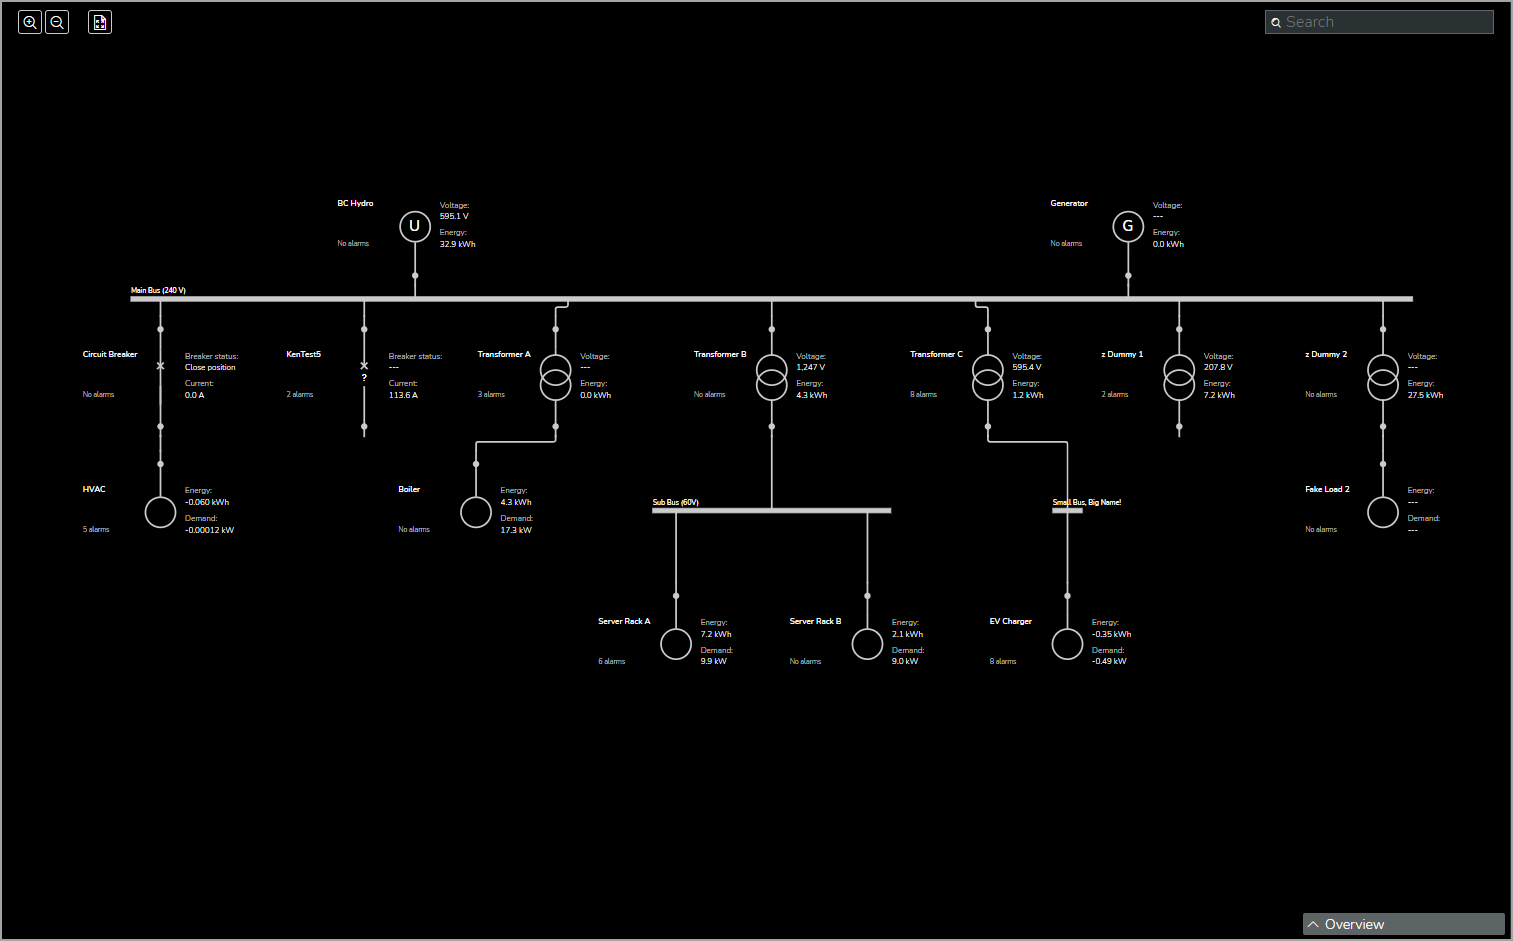
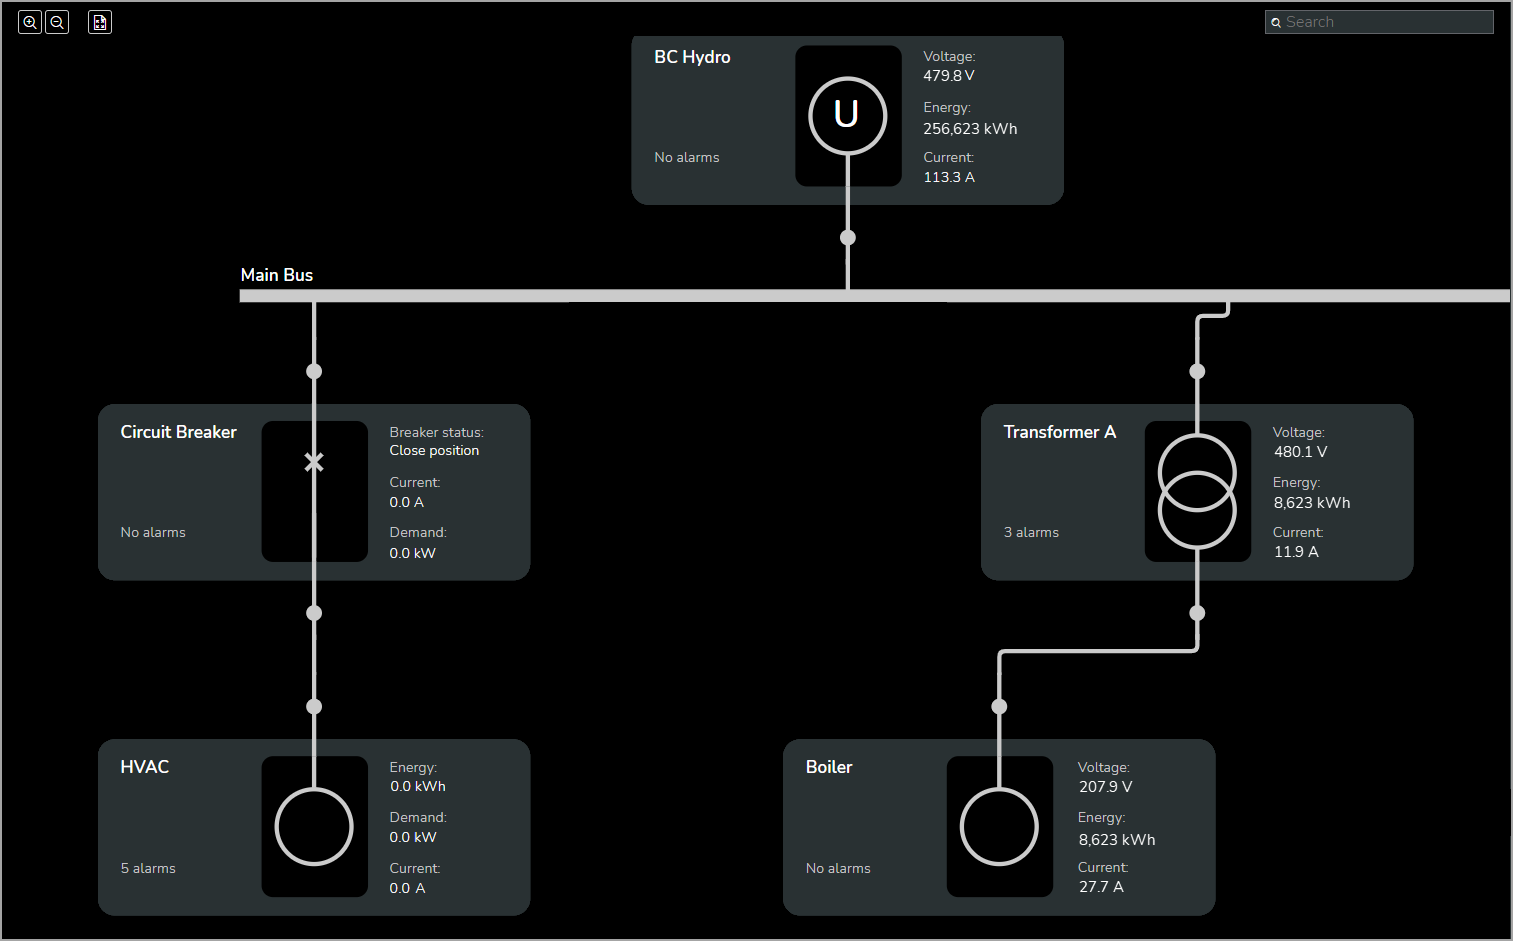
Single-line diagrams show a symbolic representation of your electrical power system. You can monitor system status and review how the electrical components in your power system are connected. You can only create single-line diagrams for your sites, not for other locations. Different sites can have different single-line diagrams, but there can only be one diagram per site.
IMPORTANT: The data displayed is not in real-time. It shows the latest logged data for the equipment or monitoring device. Updates occur every 10 minutes.
Single-line diagram includes the following data:
- Current
- Voltage
- Power demand
- Electric energy
- Breaker status
There are no software-based alarm types for Single-line diagrams. To learn more about alarming in Energy Hub, see Alarming.
Prerequisites
Verify that:
- You have an active Energy Hub subscription that includes this feature. For information on subscriptions, see Energy Hub subscriptions.
- Power monitoring devices are installed in your facility to monitor loads such as lighting, air conditioning, plug loads, and other consumers.
- The monitoring devices are connected to communication gateways, for example Site Server or Panel Server, that are sending measurement data to Energy Hub over the internet.
- The communication gateways have been added to your organization in Energy Hub.
Configuration
Create a single-line diagram for the monitored site
For step-by-step instructions on this configuration task, see single-line diagram tasks.
You can view single-line diagrams in the Electrical view in Investigate. For step-by-step instructions on how to view single-line diagrams, see viewing single-line diagrams.
Examples:
Single-line diagram zoomed out (shown in dark mode):

Single-line diagram zoomed in (shown in dark mode):
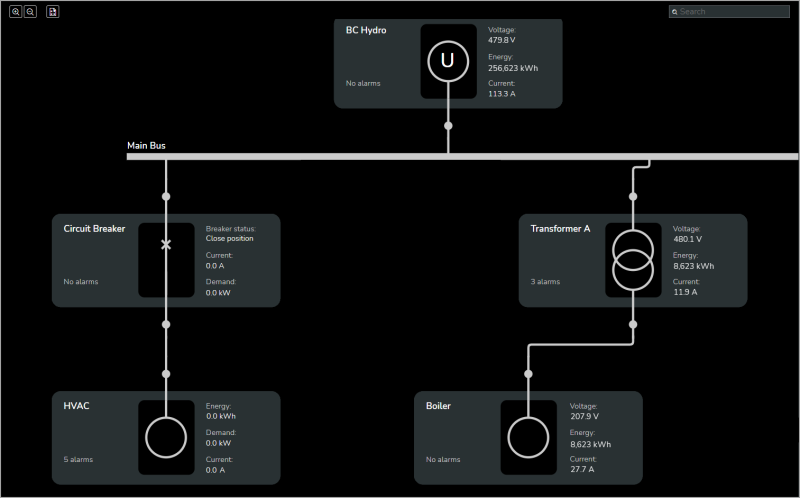
Single-line diagram zoomed in (shown in dark mode):
There is no reporting for single-line diagrams.
[Web app and mobile app]
Cable overheating detection provides an early warning system for the detection of overheating cables in low-voltage (LV) equipment, such as switchboards or panelboards. Overheating cables can cause equipment damage and fires.
PowerLogic™ HeatTag™ wireless sensors that are installed in the equipment can detect gases and particles that are released when cables are overheating. When the gas and particle concentration reaches a certain limit, the HeatTag sensors generate alarms that are displayed in Energy Hub.
HeatTag alarms
Asset monitoring alarms
HeatTag devices generate a Thermal / temperature alarm when detecting cable overheating conditions. The priority of this alarm increases as the gas and particle concentration increases:
- Low priority Thermal / temperature alarm (cables are beginning to overheat and maintenance actions should be planned).
- Medium priority Thermal / temperature alarm (cables are overheating; timely action is required).
- High priority Thermal / temperature alarm (cables are overheating fast; immediate action is required).
Diagnostics alarms
HeatTag devices generate two types of diagnostics alarms:
- High priority Device replacement alarm (HeatTag sensor is out of service).
- High priority Fan error alarm (HeatTag fan needs cleaning).
Energy Hub notifications
Energy Hub sends three types of notifications:
- Notification when a HeatTag alarm goes active or inactive.
- (*) Notification if HeatTag alarms have been active for more than two weeks. This notification is sent every two weeks until the alarms are no longer active.
- (*) Notification if no alarms have been generated by HeatTag devices for a site in the previous three months.
(*) These notifications are not controlled by the notification settings in Energy Hub and cannot be disabled.
Overheating of cables can take days, weeks, or months until enough gas and particles are produced to trigger an alarm. However, continuous monitoring is important, which means you need a reliable communication network that connects the HeatTag sensors to the communication gateway and the gateway to Energy Hub.
- Device-based communication loss alarms have a Low alarm priority in Energy Hub. Do not ignore these alarms for devices that are related to cable overheating detection monitoring.
- You do not receive HeatTag alarms and notifications during a communication interruption between the HeatTag sensors, communication gateways, Energy Hub, and your email or mobile device.
Energy Hub includes a gateway communication loss software alarm that monitors the communication link between Energy Hub and the communication gateways. This alarm can notify you of communication issues. See software-based alarms to review the details of this alarm and to understand its behavior and limitations.
For detailed information on PowerLogic HeatTag sensors, see the HeatTag user guide (download page) and other product information available on the Schneider Electric website.
For information on the technology used by HeatTag sensors for detecting cable overheating, see [white paper]: New gas and particle sensing technology detects cables overheating in LV equipment (download page).
HeatTag devices generate device-based alarms for cable overheating detection.
There are no software-based alarm types for cable overheating detection.
To learn more about alarming in Energy Hub, see Alarming.
For details on software-based alarms, see Software-based alarms.
Prerequisites
Verify that:
- You have an active Energy Hub subscription that includes this feature. For information on subscriptions, see Energy Hub subscriptions.
- HeatTag monitoring devices are installed in the relevant locations in your facility.
- The monitoring devices are connected to communication gateways, for example Site Server or Panel Server, that are sending measurement data to Energy Hub over the internet.
- The communication gateways have been added to your organization in Energy Hub.
Configuration
Cable overheating detection generates low, medium, and high priority asset monitoring alarms when detecting cable overheating conditions and high priority diagnostics alarms related to the operational condition of the HeatTag sensors. To receive alarm notifications for cable overheating detection alarms, verify that alarm notification is enabled for asset monitoring alarms with low, medium, and high priority.
- No configuration is required for cable overheating detection.
- To customize alarm notifications, edit the notification settings in Energy Hub.
For step-by-step instructions on how to edit notification settings, see To edit notification settings.
The monitoring and detection of cable overheating is done by the HeatTag sensors that are installed in your facility. When a HeatTag detects an overheating condition, it generates an alarm.
For step-by-step instructions on how to view alarm information, see To view alarm information.
[Web app]
You can create a report for cable overheating alarms by printing the data displays in the Asset view in Investigate, or by saving them as a PDF output. Printing or saving as PDF is not available for alarms displayed in Inbox. CSV export is not available for alarm displays. For step-by-step instructions on how to report on energy system data, see Reporting tasks.
[Mobile app]
There is no reporting for cable overheating detection in the mobile app.