Troubleshooting details
Get help with unexpected system behavior in Energy Hub.
Functionality
Functions and user interfaces (UIs)
Behavior
The display language for user interface text is inconsistent. For example, some text is displayed in one language, other text, such as dates, is displayed in a different language.
Probable cause
The language settings in Energy Hub and in your web browser are different. Some of the display language in the Energy Hub user interface is controlled by the language setting in Energy Hub, and some of it is controlled by the language setting of your web browser.
Actions
To have a consistent display language, use the same language setting in Energy Hub and your browser. For information on how to change the language in Energy Hub, see To change the display language for Energy Hub. For information on how to change the language and regional settings of your browser, check your browser's help documentation.
NOTE: The data formats, for example, for dates and numbers, are controlled by the regional settings of your browser. To see data formats in Energy Hub that are appropriate for your region, select the correct regional settings for your locale in your browser.
If you cannot resolve this issue, contact Technical Support.
Functionality
Behavior
For Energy Hub organizations with multiple sites, users can only see data for some of the sites but not others, for example on the Home page or in Investigate.
Probable cause
User access permissions control which data a user can see in Energy Hub. For example, access permissions can restrict data access to certain regions or sites. If a user cannot see data for a site, they might not have the required access permissions.
Actions
Check the user's access permissions. Adjust the access permissions to give this user access to those locations in the organization that they are expected to be able to access. For step-by-step instructions on how to edit access permissions, see To edit access permissions.
NOTE: Only users with the required privileges can update access permissions. For information on user privileges, see User privileges.
If you cannot resolve this issue, contact Technical Support.
Functionality
Behavior
The display shows "No data", "Not available", or shows "– – –" instead of data values.
Probable cause
No data
Energy Hub displays "No data" messages if it cannot find the data that is requested for the selected location or equipment for the selected date range. This could be caused by:
- There is no data for the selected date range.
- The monitoring device for the location or equipment is not recording the required data.
- The data is not uploaded from the device to Energy Hub.
Not available
Energy Hub displays "Not available" when comparing data between locations or equipment, if that data is unavailable for any reason. In addition, Energy Hub displays on-screen messages with information on probable causes and troubleshooting actions.
"– – – "
Energy Hub displays "– – –" if fundamental issues are preventing the display of the information, such as incorrect or missing system configuration, or unknown system events. In addition, Energy Hub displays on-screen messages with information on probable causes and troubleshooting actions.
Actions
No data
To troubleshoot this system behavior, check the following:
- Is data available for other date ranges?
- Are other locations or equipment displaying data?
- Is the monitoring device for the location or equipment recording the required data?
- Is the communication gateway connected to the device and connected to Energy Hub?
- Is the gateway configured correctly?
Not available
Review and follow the on-screen messages with information on probably causes and troubleshooting actions.
"– – – "
Review and follow the on-screen messages with information on probably causes and troubleshooting actions.
If you cannot resolve the issue, contact Technical Support.
Examples
The following shows some examples of "No data" displays in Energy Hub.


Functionality
Behavior
In the organization tree, in Energy view:
- When selecting a region, the main display panel shows a message saying that no sites, locations, loads, and supplies have been configured for the region.
- When selecting a site, building, or other location, the main display panel shows a message saying that no loads and supplies have been configured for the location.
Probable cause
The organization model in Energy Hub has not been configured for this region or site.
An organization in Energy Hub is a logical entity that represents your business. You set up an organization to model your facility, energy networks, loads, and usage types based on how you manage them. The organization model includes locations and equipment, and the monitoring devices that are providing the measurement data for the loads and supplies in your facility. For more information on organizations, see Organizations.
In the organization model, a region must have at least one site configured, and a site must have at least one panelboard, one load, or one supply configured to display data. For information on loads and supplies, see Loads and supplies.
Actions
Configure the organization model for the region, site, or other location to represent your facility. Add loads and supplies to represent the energy consumers and energy sources in your facility. At a minimum, add one site to the region and add one panelboard, load, or supply to the site.
For more information, including step-by-step instructions, see:
If you cannot resolve this issue, contact Technical Support.
Examples
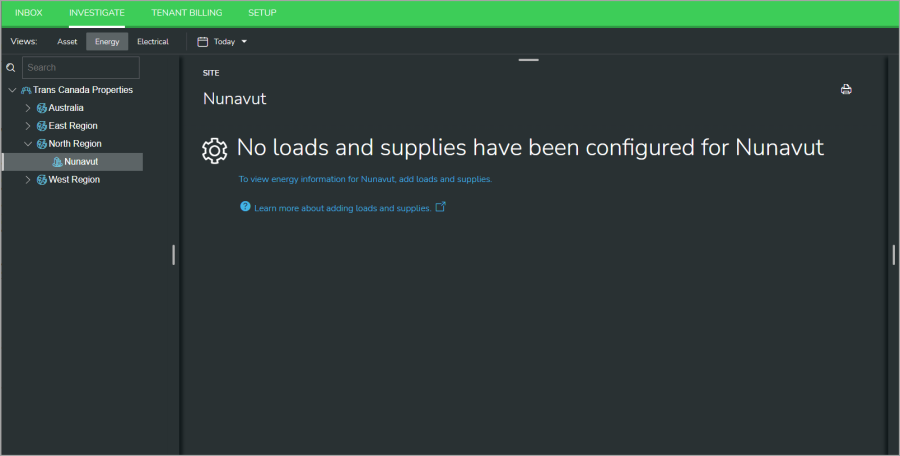
The following shows a site that does not have loads and supplies configured.
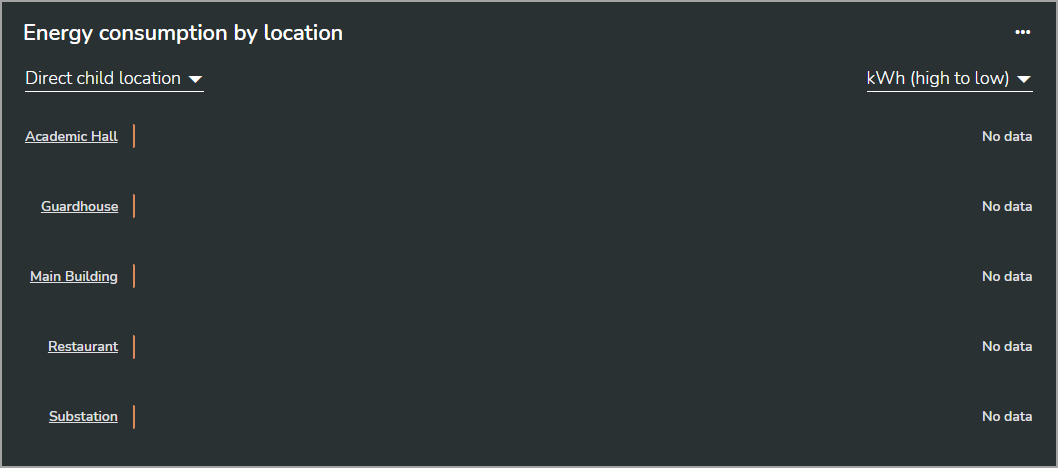
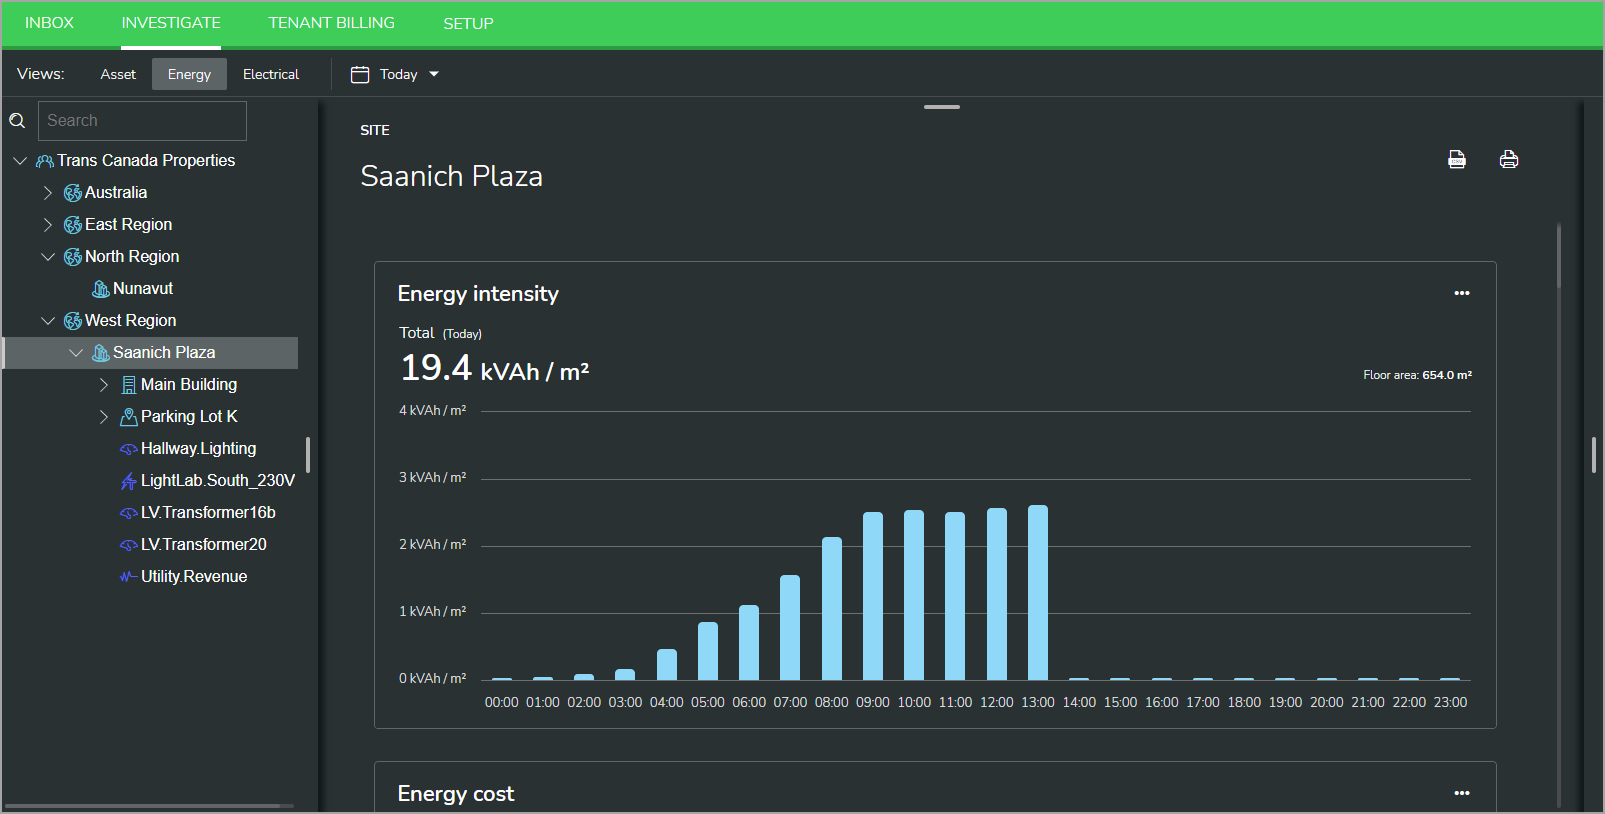
The following shows a site with child locations and their loads and supplies configured.


The following shows a site with child locations and their loads and supplies configured.
Functionality
Behavior
The display shows a message saying that the selected location has no direct child locations.
Probable cause
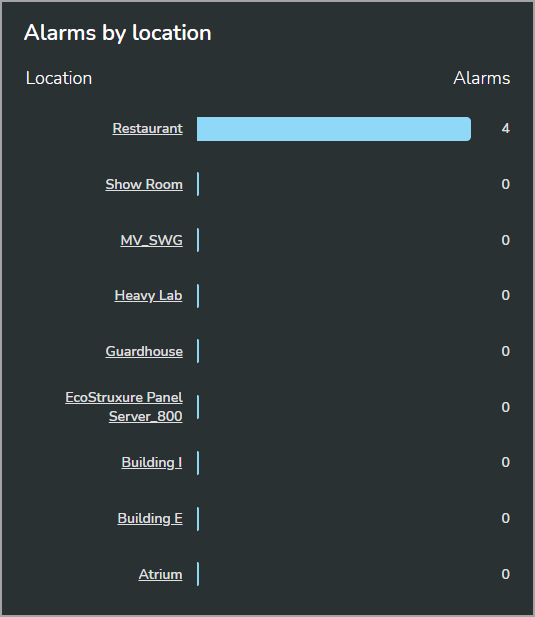
The Alarms by location display shows the number of alarms Energy Hub detected for the direct children (locations or equipment) of the item selected in the organization tree. For example, if you select a building that has floors configured in Energy Hub, the display shows the alarm counts for the floors. If you select a location without direct children, then there is nothing to display, and it shows the "No direct child locations" message instead.
Actions
No actions are required. Energy Hub behaves as expected.
If the location you selected in the organization tree has children (locations or equipment) in your-real life facility that you want to monitor, then install monitoring devices for these children, add them to your Energy Hub system, and configure them in Energy Hub. For information on organization models in Energy Hub, see Organizations.
Examples
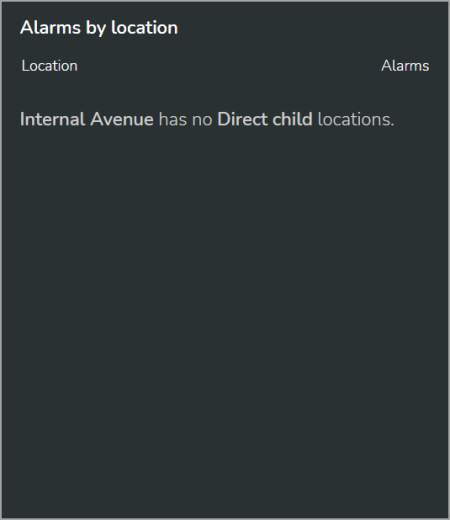
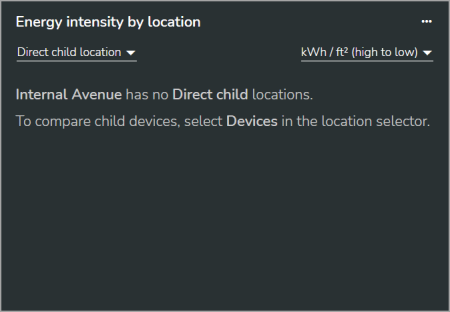
The following shows the display for a location without direct child locations and with direct child locations:
Without direct child locations
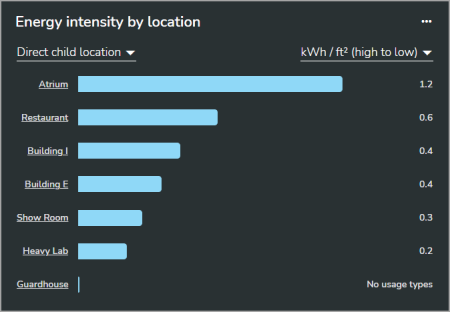
With direct child locations – The selected location in the organization tree is a site. The child locations are buildings that are configured directly below the site in Energy Hub.


With direct child locations – The selected location in the organization tree is a site. The child locations are buildings that are configured directly below the site in Energy Hub.
Functionality
Behavior
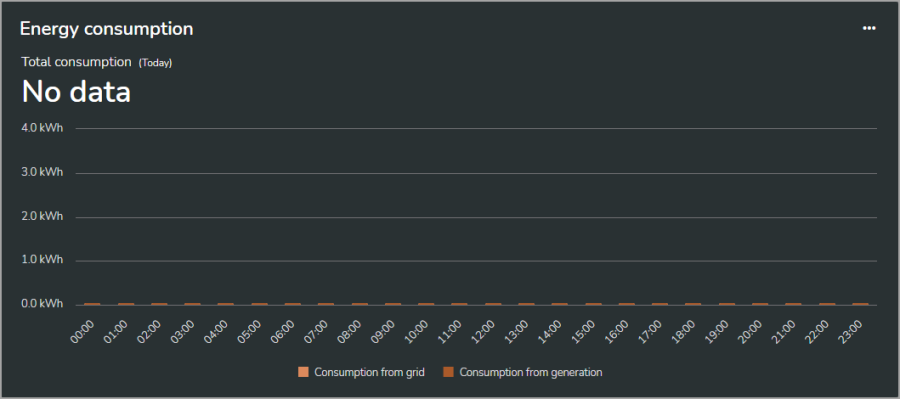
The display shows a message saying that there is no data for the selected device.
Probable cause
This message means that Energy Hub has never received data from the device.
Actions
For Energy Hub to receive data from a device, the device must log the data, send it to a gateway, and then the gateway must forward it to Energy Hub. To troubleshoot, start with the device. If the device or gateway was just added to Energy Hub, wait 30 minutes to an hour. If no data is available after this time, check if other devices connected to the gateway have data in Energy Hub. If they do, review the device configuration. If they don't, check the gateway configuration and ensure the topology has been published by the gateway.
If you cannot resolve this issue, contact Technical Support.
Functionality
Behavior
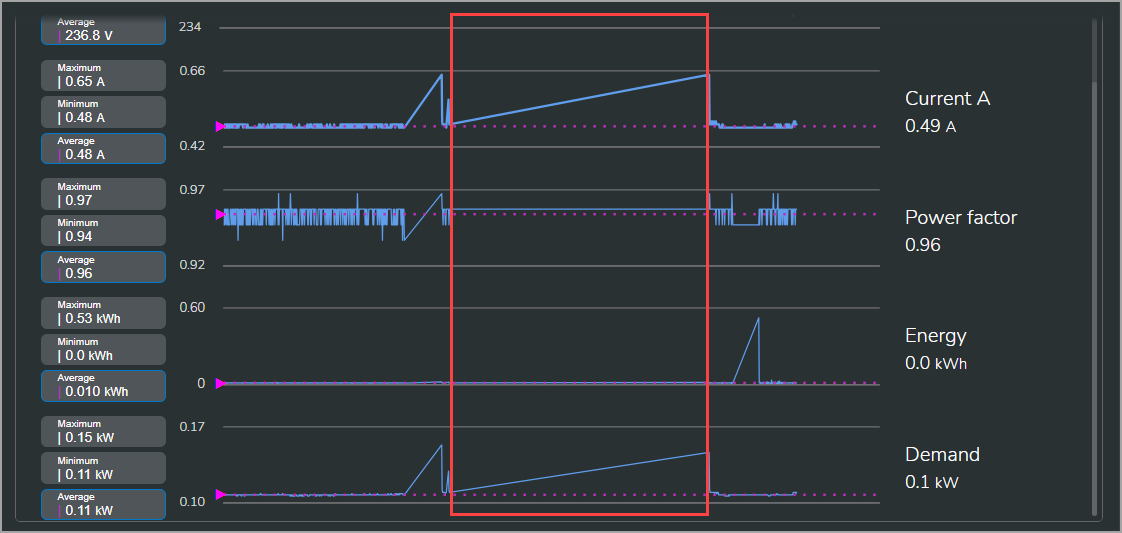
Trends shows data (lines in the chart) for periods when communications with the monitoring device was interrupted.
Example:
Device communications was interrupted during the time period marked with the red rectangle in the screen capture below.

Probable cause
Energy Hub does not display new data points while communications are interrupted. After device communications are re-established, Energy Hub starts showing new data, and it visually connects the first new data point with the last data point before the interruption.
For cumulative energy data, Energy Hub calculates the difference between the first new energy value after the interruption and the last energy value before the interruption and displays it as interval data for the time when communications were re-established. This leads to a onetime spike in the energy trend.
The table below shows how the Trends display handles load related measurements (current, energy, demand, power factor) when the gateway, the monitoring device, or the load are interrupted:
| Scenario | Trends display and CSV file export |
|---|---|
| Gateway: ON Device: ON Load: OFF |
"0" values during the outage. Non-zero values when the load is back on. |
| Gateway: ON Device: OFF Load: ON |
No values during the outage. The last known value is shown with its timestamp in the display. Non-zero values when the load is back on. The last known and first new values are connected in the display. |
| Gateway: OFF Device: ON Load: ON |
No values during the outage. The last known value is shown with its timestamp in the display. Non-zero values for instantaneous measurements and spikes for cumulative (energy) measurements when the load is back on. The last known and first new values are connected in the display. |
| Gateway: OFF Device: OFF Load: ON |
No values during the outage. The last known value is shown with its timestamp in the display. Non-zero values when the load is back on. The last known and first new values are connected in the display. |
Actions
No actions required. The system operates as designed.
Functionality
Behavior
Energy trends oscillate between zero and non-zero values for energy data that is older than a certain date.
Probable cause
A Panel Server gateway with data logging (PAS800) is used to collect data from monitoring devices and sensors. This gateway was set up as a standalone energy server before it was connected to Energy Hub. As a standalone server, the data logging rate for Panel Server was set to an interval that is longer than the interval used by Energy Hub.
When Panel Server was connected to Energy Hub, its data logging rate was automatically changed to a shorter, five-minute interval, the interval used by Energy Hub. After the change in logging rate, Panel Server automatically converted its historical data into a data set with five-minute intervals. The old data was aligned with the new five-minute interval based on timestamps. Panel Server filled the gaps in the new data set by duplicating the last data points before the gaps.
Since Energy Hub displays incremental energy consumption over time, not cumulative energy, it calculates the delta between the current energy value and the previous value. This causes zero energy data points for the data inserted by Panel Server to fill the gaps.
The following shows an example:
Original Panel Server data log with 10-minute cumulative energy data:
| 8:00 | 500 Wh | Measured value |
| 8:10 | 1000 Wh | Measured value |
| 8:20 | 1500 Wh | Measured value |
| ... |
New Panel Server data log, converted to 5-minute cumulative energy data:
| 8:00 | 500 Wh | Measured value |
| 8:05 | 500 Wh | Repeated value |
| 8:10 | 1000 Wh | Measured value |
| 8:15 | 1000 Wh | Repeated value |
| 8:20 | 1500 Wh | Measured value |
| 8:25 | 1500 Wh | Repeated value |
| ... |
Energy Hub data log with incremental energy data:
| 8:00 | 500 Wh | |
| 8:05 | 0 Wh | |
| 8:10 | 500 Wh | |
| 8:15 | 0 Wh | |
| 8:20 | 500 Wh | |
| 8:25 | 0 Wh | |
| ... |
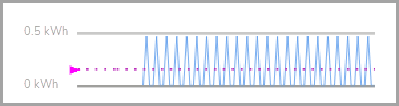
Oscillating energy trend display:
Actions
No actions required. The system operates as designed. This behavior only affects data that was recorded by Panel Server before it connected to Energy Hub. Data recorded after Energy Hub connected to Panel Server will be displayed without the oscillation.
Functionality
Behavior
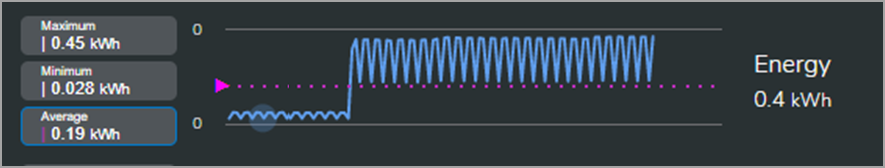
Energy values shown in the energy trend fluctuate even if the load is constant.
Example:


Probable cause
Monitoring devices log cumulative energy values. Communication gateways read the logged data from the devices at certain intervals. Differences in device logging rates and gateway update intervals, or communication delays and short interruptions between the gateway and the device, can cause variations in the data flow.
Energy Hub receives the cumulative energy data from the gateways. It then calculates the delta between the current cumulative energy value and the previous cumulative value and displays incremental energy consumption over time. Variations in the data flow can lead to a periodic over or under reporting of the energy consumption. This causes the energy trend to fluctuate. The fluctuations even out in consecutive intervals. See Trends: Energy trend for PowerTag Rope fluctuates. for a related troubleshooting case.
Actions
No actions required. The system operates as designed.
Functionality
Behavior
Energy values for PowerTag Rope fluctuate even if the load is constant.
Example:

Probable cause
A Panel Server gateway is used to collect data from the PowerTag Rope device. The update interval of Panel Server is different from the data logging rate of the PowerTag Rope. The difference leads to a periodic over or under reporting of the energy consumption.
Since Energy Hub displays incremental energy consumption over time, not cumulative energy, it calculates the delta between the current energy value and the previous value. This causes the energy trend to fluctuate. The fluctuations even out in consecutive intervals.
The following shows an example for a 5 kW load (energy consumption = 250 Wh / 3-minute interval):
| Time | PowerTag Rope cumulative energy reading [Wh] | Panel Server cumulative energy reading [Wh] | Energy Hub incremental energy trend [Wh] |
| 8:00 | 0 | 0 | 0 |
| 8:01 | |||
| 8:02 | |||
| 8:03 | 250 | ||
| 8:04 | |||
| 8:05 | 250 | 250 | |
| 8:06 | 500 | ||
| 8:07 | |||
| 8:08 | |||
| 8:09 | 750 | ||
| 8:10 | 750 | 500 | |
| 8:11 | |||
| 8:12 | 1000 | ||
| 8:13 | |||
| 8:14 | |||
| 8:15 | 1250 | 1250 | 500 |
| 8:16 | |||
| 8:17 | |||
| 8:18 | 1500 | ||
| 8:19 | |||
| 8:20 | 1500 | 250 | |
| 8:21 | 1750 | ||
| 8:22 | |||
| 8:23 | |||
| 8:24 | 2000 | ||
| 8:25 | 2000 | 500 | |
| 8:26 | |||
| 8:27 | 2250 | ||
| 8:28 | |||
| 8:29 |
Analysis:
- PowerTag Rope measures cumulative energy and logs its measurement data every 3 minutes.
- Panel Server records the logged cumulative energy data from PowerTag Rope every 5 minutes.
- Energy Hub calculates incremental energy data from the Panel Server data logs.
- The incremental energy data in Energy Hub fluctuates caused by the difference in logging rates between PowerTag Rope and Panel Server.
- The fluctuations even out in consecutive intervals.
Actions
No actions required. The system operates as designed.
Functionality
Behavior
Heat energy and heat power are not displayed in the Asset view in Investigate.
Probable cause
Assumption: Heat energy monitoring devices with kWh pulse outputs are installed in your facility and connected to Energy Hub through a communication gateway.
The Commodity setting in Energy Hub for the heat monitoring device is not set correctly. The Commodity setting for water heat monitoring devices must be set to Water. The Commodity is set automatically, based on the gateway setting, when a device is first added to the system.
Actions
Verify that the Commodity for the heat monitoring devices is set to Water. If it is not set to Water, set it to Water in the device settings in Energy Hub. For information on how to change device settings, see To edit device settings.
If you cannot resolve this issue, contact Technical Support.
Functionality
Behavior
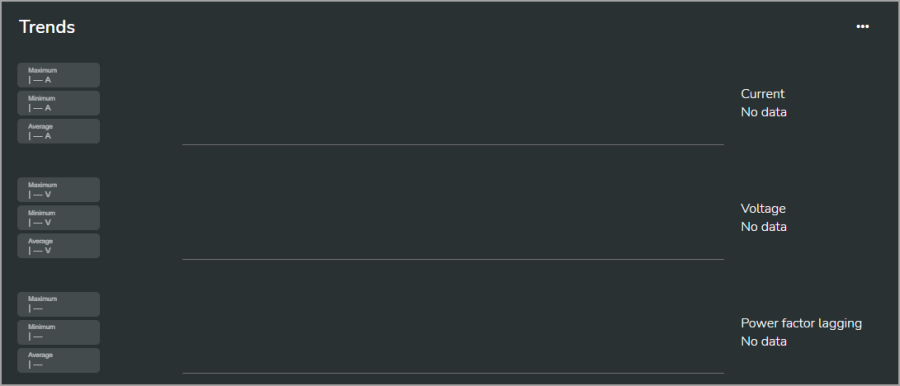
The display shows a message saying that equipment status is not available and one of the following:
- The type of device does not provide status information, or
- No main (incoming) device has been defined, or
- More than one main (incoming) device has been defined, or
Probable cause
- The selected device or equipment type does not provide the required measurement data. The Equipment status shows power system data, such as voltage, current, and status. Which data is displayed depends on the type of equipment or device. Some device types, such as virtual devices, do not provide any data.
- No main (incoming) device has been assigned. For panelboards, the display shows the data for the device monitoring the main (incoming) supply of the panelboard. If no main (incoming) device has been assigned, then the display does not show any data.
- More than one main (incoming) device has been assigned. For panelboards, the display shows the data for the device monitoring the main (incoming) supply of the panelboard. If more than one main (incoming) device has been assigned, then it does not show any data.
Actions
- No actions required. Energy Hub behaves as expected. The selected device or equipment type does not provide data that could be displayed.
- Assign the device that is monitoring the supply of the panelboard as main (incoming). For information on how to assign device context for a device, like main (incoming), see To assign device context for a panelboard.
- Unassign all but one device as main (incoming) for the panelboard. There should only be one main (incoming) device for a panelboard. For information on how to unassign device context for a device, like main (incoming), see To unassign device context for a panelboard.
If you cannot resolve this issue, contact Technical Support.
Examples
The following shows an example of the message displayed for behavior 2.
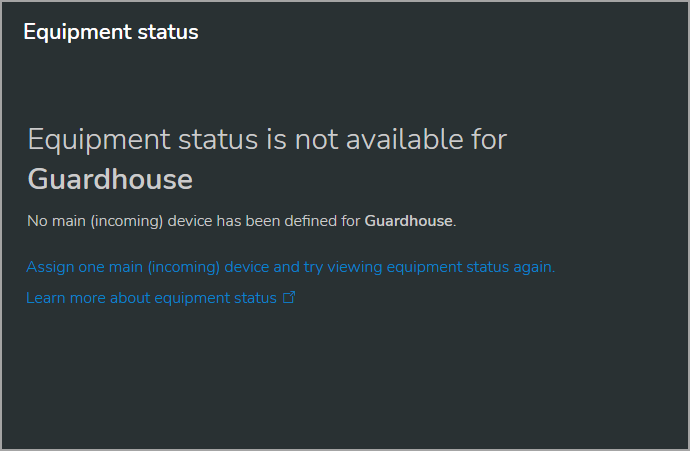
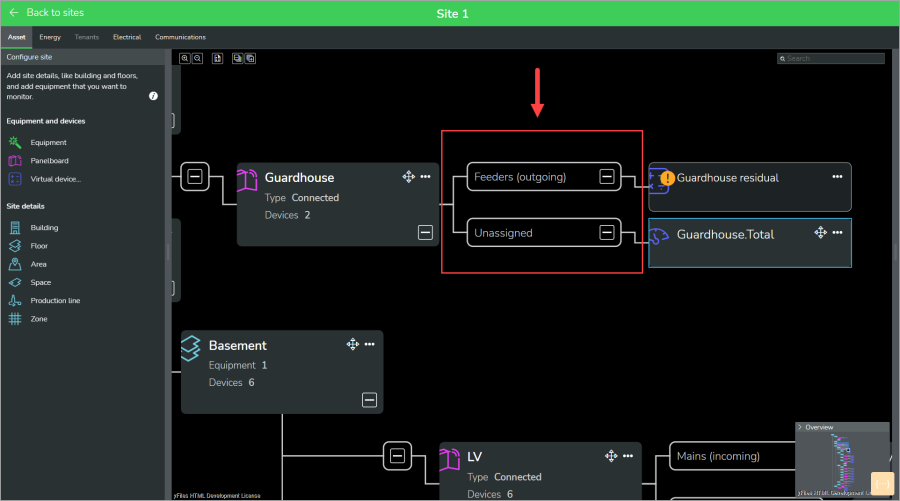
The following shows a panelboard that does not have a main (incoming) device assigned.
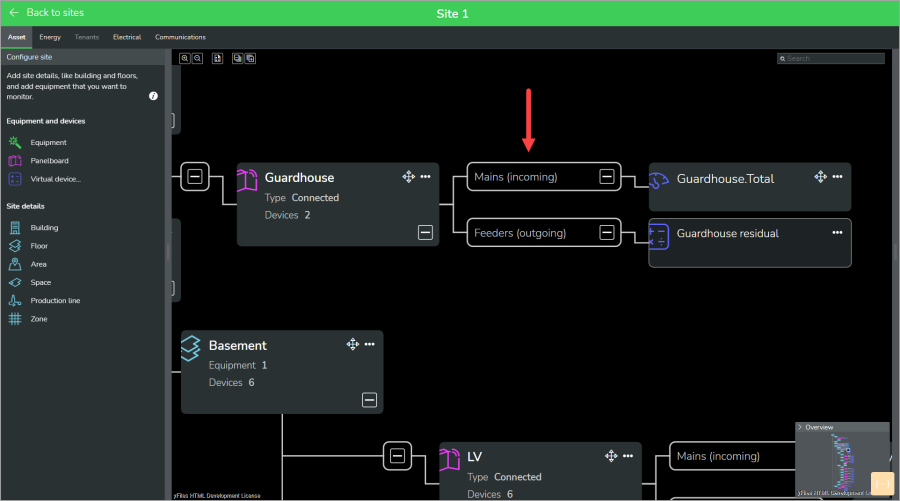
The following shows the same panelboard with a main (incoming) device assigned.
The following shows a panelboard that does not have a main (incoming) device assigned.

The following shows the same panelboard with a main (incoming) device assigned.

Functionality
Energy consumption by usage type
Behavior
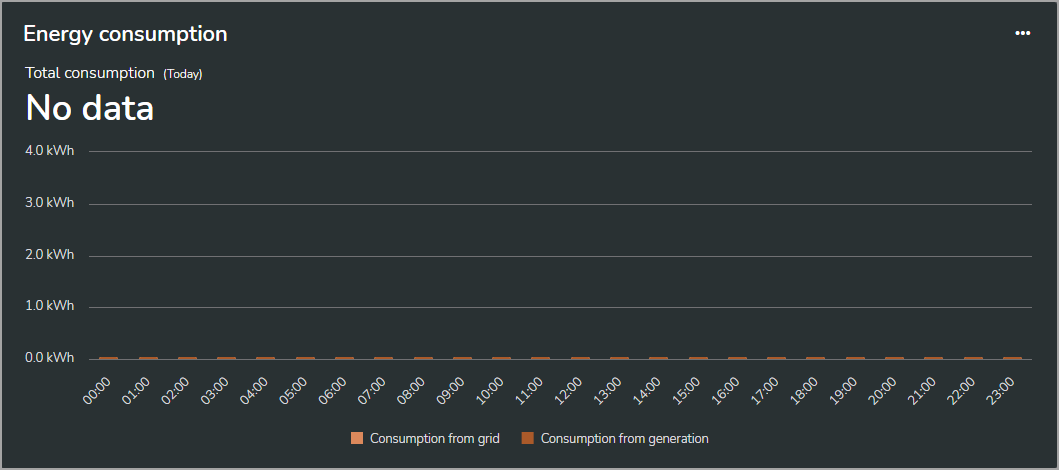
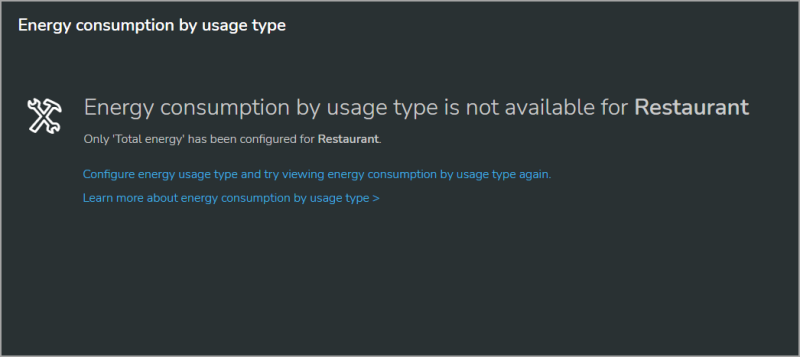
The display shows a message saying that the display is not available because only Total energy has been configured for the selected location.
Probable cause
The energy consumption by usage type display shows energy consumption categorized by energy usage types for the selected location in the organization tree. For example, if you select a floor, it might display consumption for lighting, heating, and other usage types for this floor.
Energy Hub calculates consumption by usage types based on the loads and usage types for the selected location. The message that is displayed shows that only Total energy has been configured for this location. Total energy is a supply usage type. You need to configure at least one load usage type for this location. For more information on usage types, see Consumption > Details.
Actions
Confirm that monitoring devices for the loads in the selected location are available in Energy Hub. Add the monitoring devices to the location and assign energy usage types, then try viewing consumption for this location again. For information on how to add devices to a location and assign usage types, see To add a load or supply and assign an energy usage type.
If you cannot resolve this issue, contact Technical Support.
Examples
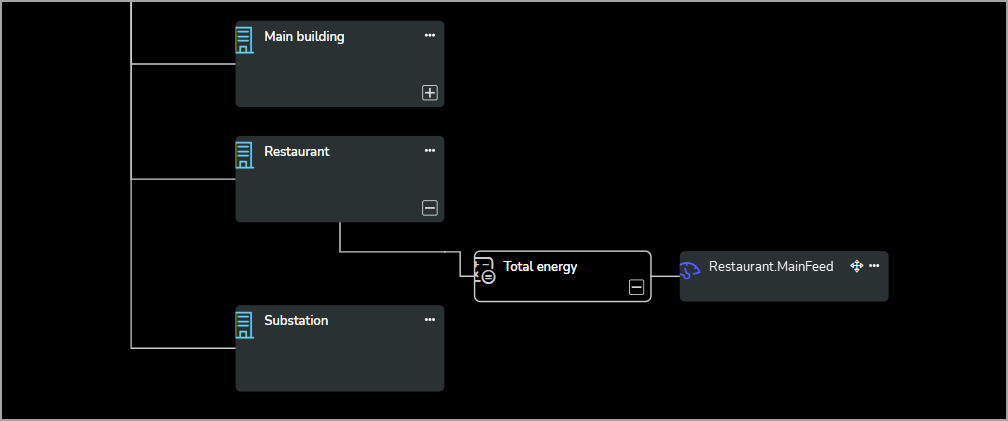
The following example shows a location that has only the Total energy usage type configured. The display shows a "not available" message.
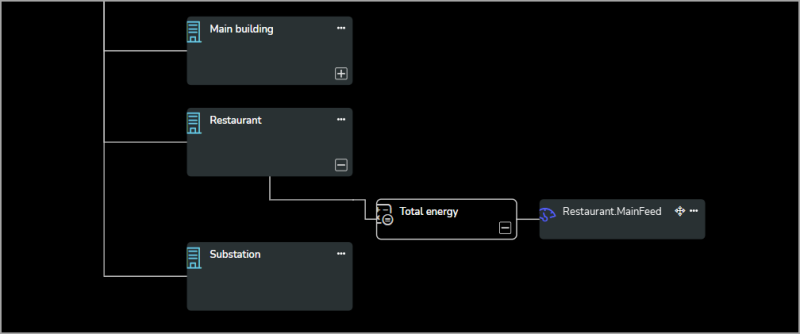
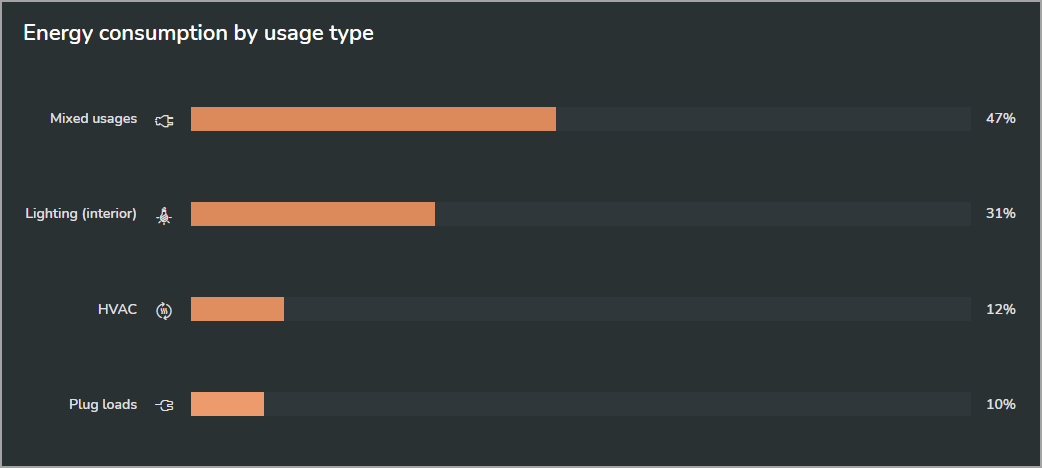
The following example shows the same location with load energy usage types configured. The display shows the consumption by usage type for this configuration.
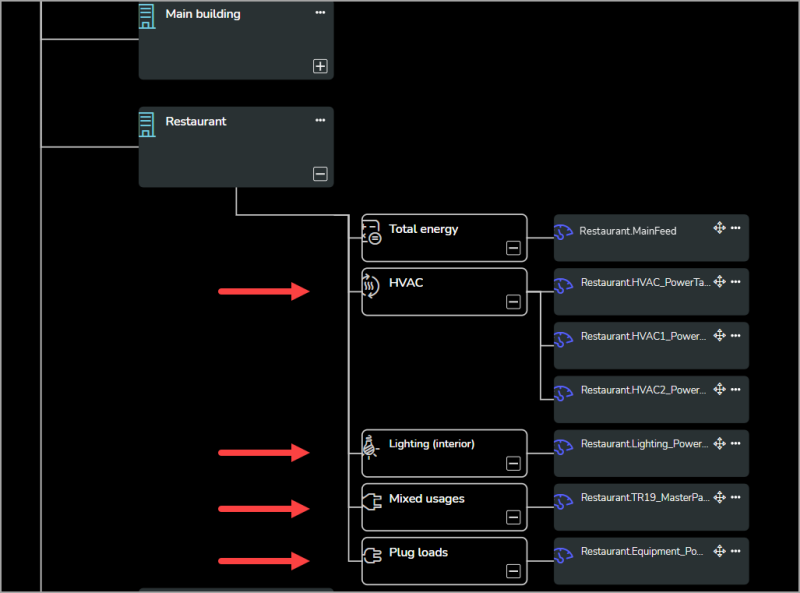


The following example shows the same location with load energy usage types configured. The display shows the consumption by usage type for this configuration.

Functionality
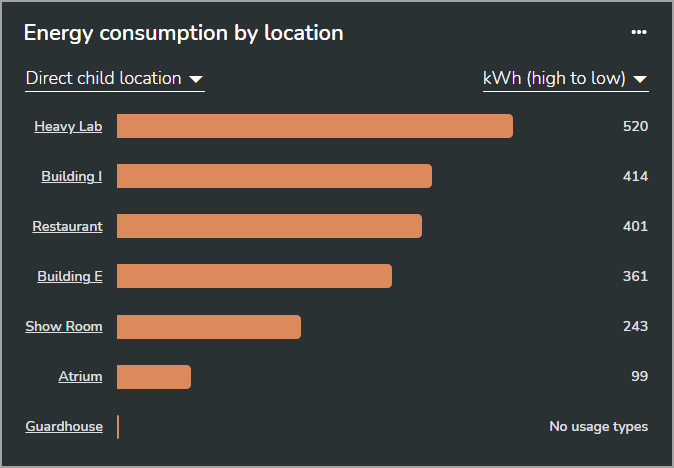
Energy consumption by location
Behavior
The display shows a message saying that the selected location has no direct child locations.
Probable cause
Energy consumption by location, Energy intensity by location, and Water intensity by location show energy consumption, energy intensity, and water intensity for the direct child locations of the item selected in the organization tree. For example, if you select a building that has floors configured in Energy Hub, the displays show the energy consumption and intensity or water intensity for the floors. If you select a location without direct child locations, then there is nothing to display, the "No direct child locations" message is displayed instead.
Actions
No actions are required. Energy Hub behaves as expected.
If the location you selected in the organization tree has child locations in your-real life facility that you want to monitor, then install monitoring devices for these locations, add them to your Energy Hub system, and configure those child locations in Energy Hub. For information on organization models in Energy Hub, see Organizations.
Examples
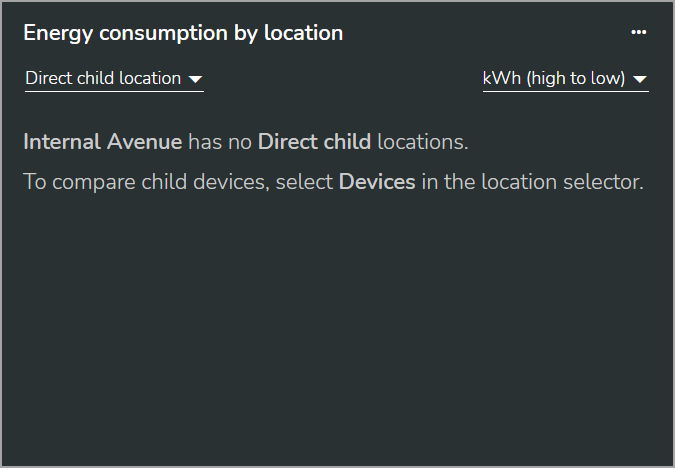
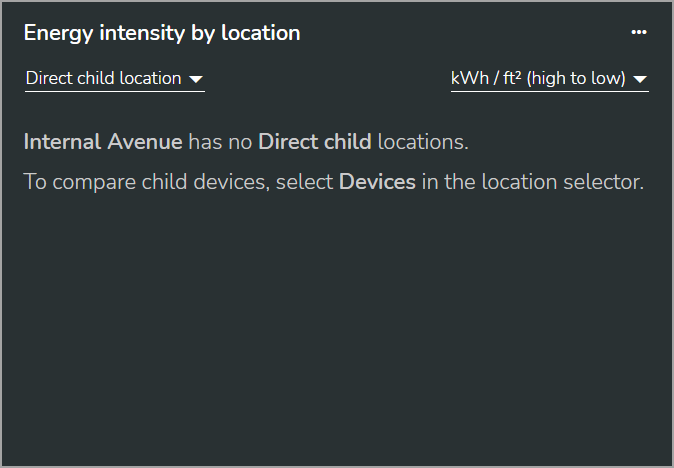
The following shows the display for a location without direct child locations and with direct child locations:
Without direct child locations

With direct child locations– The selected location in the organization tree is a site. The child locations are buildings that are configured directly below the site in Energy Hub.

With direct child locations– The selected location in the organization tree is a site. The child locations are buildings that are configured directly below the site in Energy Hub.

Functionality
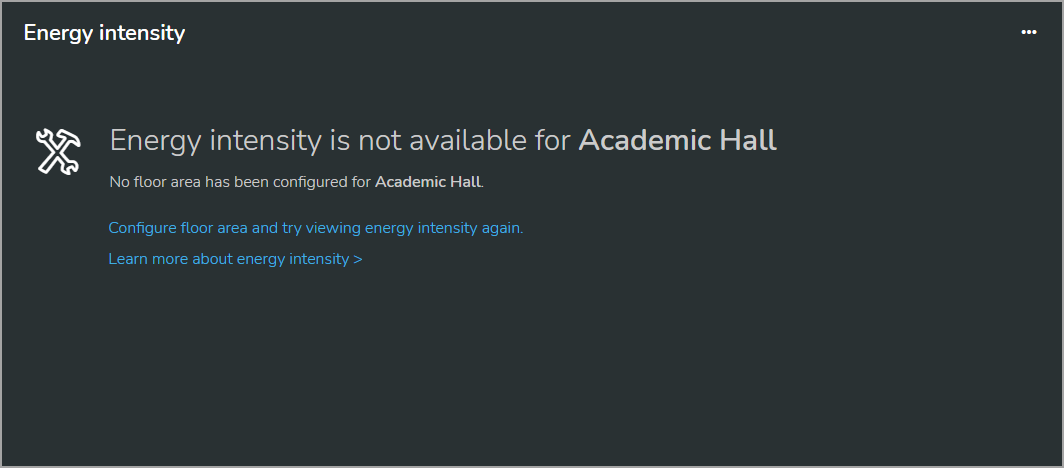
Behavior
The display shows a message saying that no floor area has been configured for the selected location.
Probable cause
No floor area has been set for the location. Energy Hub uses the floor area to calculate energy and water intensity. The floor area can be set for any location in the organization tree. Energy Hub aggregates and rolls up floor area of child locations to the parent. For more information on intensity and floor area, see Intensity.
Actions
Set the floor area for the selected location. For information on how to set the floor area for a location, see To set a floor area for a location.
If you cannot resolve this issue, contact Technical Support.
Examples
The following shows a location that does not have a floor area configured. The display shows a "no floor area configured" message.

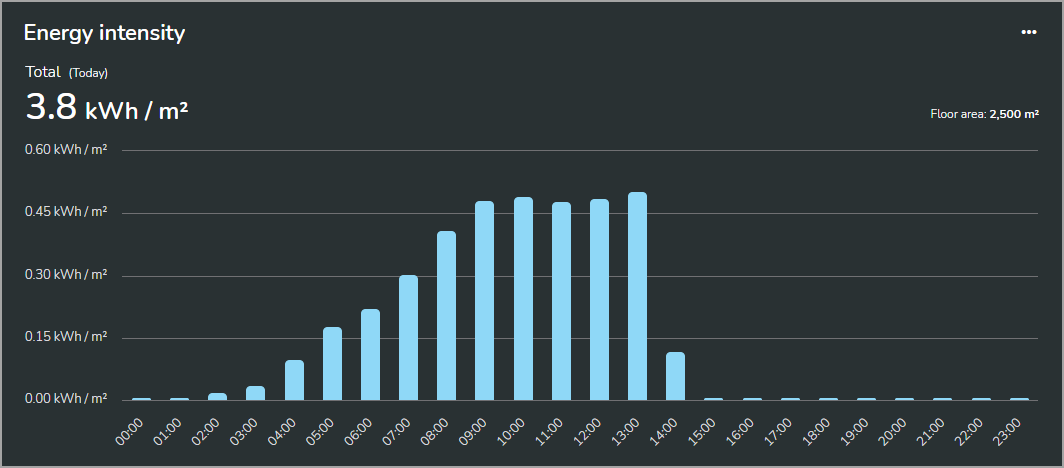
The following shows the same location with the floor area configured. The display shows the energy intensity for the location.

The following shows the same location with the floor area configured. The display shows the energy intensity for the location.
Functionality
Energy consumption (and generation)
Behavior
The displays show on-site generated energy as grid consumption instead of local generation.
Probable cause
The device monitoring local consumption has been wired in reverse. Energy Hub expects the device that is monitoring local generation to be wired as a supply monitoring device. A supply monitoring device has its current instrument transformers (CTs) connected so that it measures generated energy as delivered (positive) and consumed energy as received (negative). If the CT connections are reversed, Energy Hub shows generated energy as consumption and consumed energy as local generation for this device. You can verify this by checking the Energy consumption (and generation) for the device in the Energy view in Energy Hub.
Actions
Confirm that the device has been wired in reverse. Use one of the following methods to correct this issue:
Preferred method:
Correct the CT wiring for the device.
Next best method
(Only for PowerTag Energy devices) Change the direction of the current measurement in the Panel Server gateway to which the PowerTag device is connected.
Fallback method
Set the Meter wiring is reversed setting for the device in Energy Hub to Yes. For information on how to change device settings, see To edit device settings.
NOTE: Using the Meter wiring is reversed setting corrects the energy data for the device in Energy Hub, but it does not correct other data such as active power or power factor.
If you cannot resolve this issue, contact Technical Support.
Functionality
Energy consumption (and generation)
Behavior
The display shows all the locally generated energy as used locally for a site. The energy sent to grid is always shown as zero.
Probable cause
Assuming the site is actually sending energy back to the grid, showing zero in Energy Hub could be caused by:
- The Total energy usage type has not been configured for the site. Total energy is a supply usage type that identifies energy supplied by the utility grid. Energy Hub uses the utility supply information to determine how much of the generated energy was used locally and how much was sent back to the utility grid. For more information on Total energy, see consumption details.
- The monitoring device for the utility supply at the site does not measure energy flow in both directions. Energy Hub needs a device that measures active energy delivered (energy from the utility) and active energy received (energy sent back to the grid). The active energy received is used to determine the locally generated energy returned to the grid.
Actions
- Configure Total energy for this site. For information on how to configure a usage type, see To add a load or supply and assign an energy usage type.
NOTE: You need a monitoring device for the utility supply for your site. Without the monitoring device, you cannot configure the Total energy usage type for a site.
- Replace the monitoring device for the utility supply at the site with a bi-directional one that can measure energy flow in both directions.
If you cannot resolve this issue, contact Technical Support.
Functionality
Behavior
The electricity, water, or gas consumption costs displayed in Investigate > Cost are lower than expected for the selected date range. The actual consumption values, for example, in kWh or m3, are shown correctly.
Probable cause
Lower than expected cost data could be caused by:
- Incorrectly configured tariffs
- A date range selection for the data display that predates the start date of the tariff that is assigned to the site.
Actions
- Verify that the correct tariffs have been assigned to the site. For step-by-step instructions on how to assign tariffs, see To assign a tariff to a site. If the correct tariffs are assigned to the site, verify that the tariffs are defined correctly. For step-by-step instructions on how to view tariff details, see To view tariff details. Correct any mistakes in the tariff definitions and try viewing the cost data again.
- Tariffs that are assigned to a site have start dates. The start date is the date from which the tariff will be applied to energy data for the site. If the selected date range for viewing cost data for a site starts at a time before the start date of the tariffs, then the displayed cost will be lower than expected. Verify that the start dates for the tariffs for this site are configured correctly.
If you cannot resolve this issue, contact Technical Support.
Functionality
Behavior
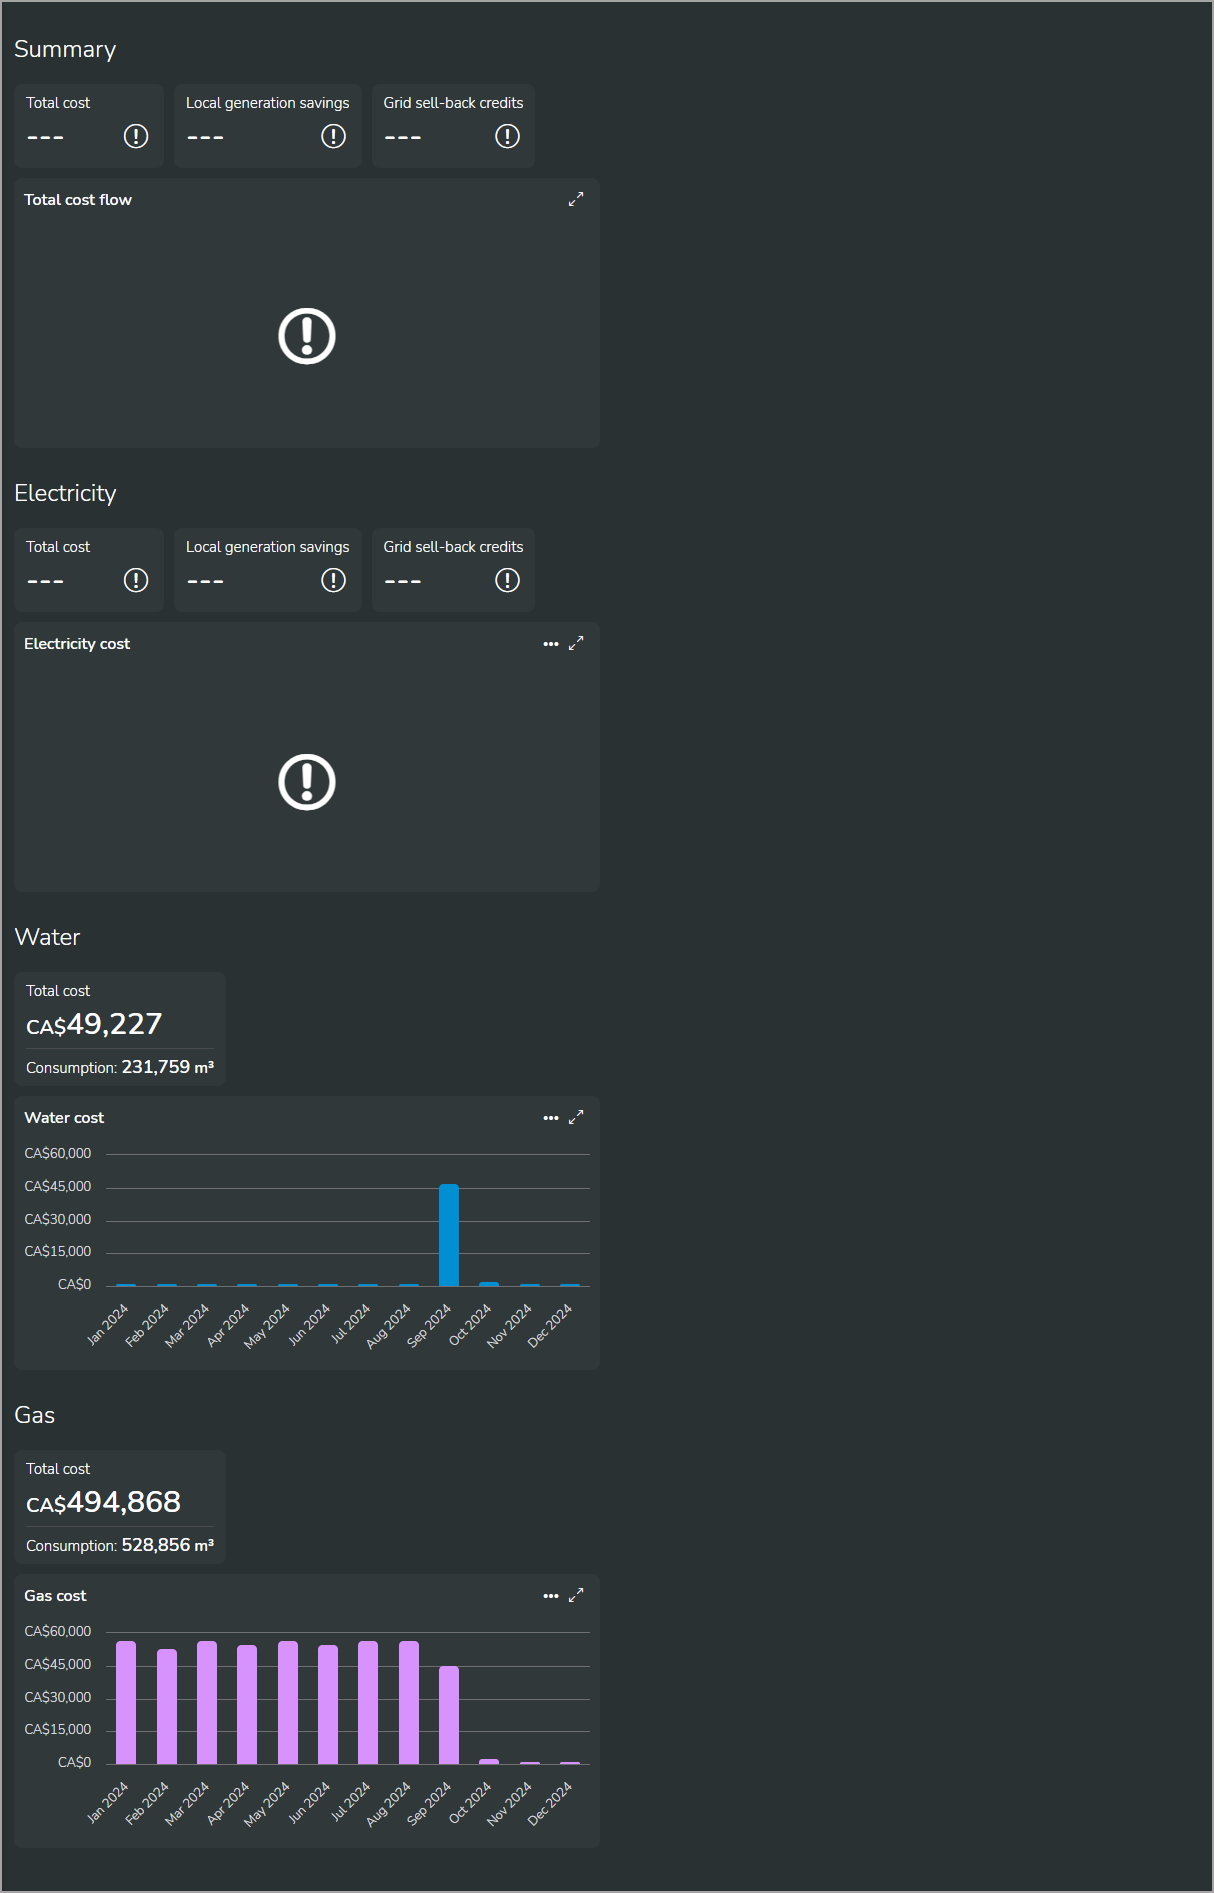
Some or all of the displays in Investigate > Cost do not display cost data but instead show exclamation marks and "– – –".
Probable cause
The selected date range for displaying cost data is too large for Energy Hub to process.
Actions
We are continuously working on improving performance, but if you see this behavior, the date range query exceeded Energy Hub's current processing capacity. The only possible action is to select a shorter date range for Cost view.
Example
The following shows a Cost view with a large date range selection. Some of the displays show exclamation marks and "– – –".