Energy and sustainability
NOTE: The functionality displayed in this topic might not be the same as what you see for your organization. Your Energy Hub feature plan subscription determines what functionality is available for this feature. For feature plan details, see Feature plans.
Overview
Monitor and track the energy consumption and cost of your facilities and processes. Gain insights into the energy profile of your organization. Compare your consumption with performance expectations defined by energy efficiency codes and standards. Track greenhouse gas emissions. Receive energy management related alarms.
Features
| Consumption |
| Consumption by business hours |
| Consumption intensity |
| Weather normalization |
| Consumption comparison |
| Demand |
| Energy performance |
| Heat energy |
[Web app and mobile app]
Consumption monitoring tracks the use of energy, water, and fuel gas in your facility. You can view consumption trends and totals for different locations or loads, and different time ranges.
Usage types
Energy Hub categorizes energy consumption and supply by energy usage types. For example, heating and lighting are common energy consumption usage types. Total energy is an example for a supply usage type in Energy Hub. Consumption without a usage type is shown as Uncategorized.
TIP: For a list of all supported energy usage types in Energy Hub, see Standards based monitoring details.
Energy Hub uses the Total energy usage type to identify incoming feeders that supply energy to panels, buildings, or sites. You assign this usage type in the same way you assign a consumption usage type.
Rules for determining total consumption for a location:
If no monitoring device has been assigned to Total energy for the location, then Energy Hub adds up all the consumption usages for the location to calculate the total.
If at least one monitoring device has been assigned to Total energy for the location, then Energy Hub uses the Total energy to determine the total consumption for this location.
NOTE: The total consumption for a parent location, for example a building, is the sum of the totals of its children, for example floors, plus any usage directly linked to the parent, for example a parking lot.
Example 1: Total consumption calculated based on consumption usages.
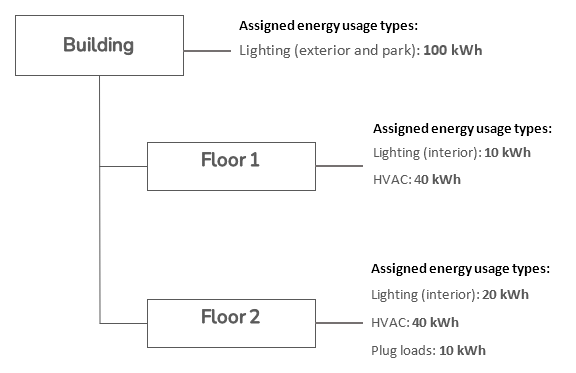
Energy Hub displays the following energy usages for the example above:
| Usage type | Floor 1 | Floor 2 | Building |
|---|---|---|---|
| Total energy consumption | 50 kWh (Lighting + HVAC) | 70 kWh (Lighting + HVAC + Plug loads) | 220 kWh (Floor 1 + Floor 2 + Building Lighting) |
| Lighting (exterior and park) | N/A | N/A | 100 kWh (Building) |
| Lighting (interior) | 10 kWh | 20 kWh | 30 kWh (Floor 1 + Floor 2) |
| HVAC | 40 kWh | 40 kWh | 80 kWh (Floor 1 + Floor 2) |
| Plug loads | N/A | 10 kWh | 10 kWh (Floor 2) |
Example 2: Total consumption determined based on Total energy.
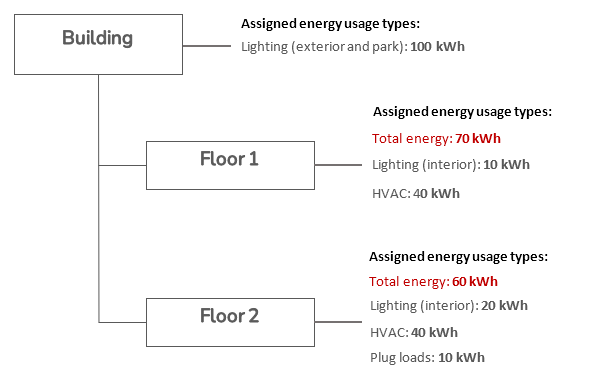
Energy Hub displays the following energy usages for the example above:
| Usage type | Floor 1 | Floor 2 | Building |
|---|---|---|---|
| Total energy consumption | 70 kWh (Total energy) | 60 kWh (Total energy) | 230 kWh (Floor 1 + Floor 2 + Building lighting) |
| Lighting (exterior and park) | N/A | N/A | 100 kWh (Building) |
| Lighting (interior) | 10 kWh | 20 kWh | 30 kWh (Floor 1 + Floor 2) |
| HVAC | 40 kWh | 40 kWh | 80 kWh (Floor 1 + Floor 2) |
| Plug loads | N/A | 10 kWh | 10 kWh (Floor 2) |
| Uncategorized | 20 kWh (Floor 1 total - Lighting - HVAC) | - 10 kWh (Floor 2 total - Lighting - HVAC - Plug loads) | 10 kWh (Building total - Lighting (exterior) - Lighting (interior) - HVAC - Plug loads) |
Uncategorized usage is the delta between the total consumption for a location and the sum of its consumption usages. This Uncategorized usage is the energy or demand that is unaccounted for in Energy Hub. If the total consumption for a location is the same as the sum of its usages, then everything is accounted for and no Uncategorized usage is shown.
Uncategorized usage = Total consumption - sum of consumption usages
NOTE: Uncategorized usage is always zero when the total consumption is calculated based on consumption usages. However, in that case the Uncategorized usage cannot be used to identify usages that are unaccounted for in Energy Hub. For more information on the Total energy usage type, see 'Total energy' usage type.
Scenarios for seeing 'Uncategorized' usage:
Scenario 1:
The total consumption for a location is greater than the sum of its usages. Energy Hub shows a positive Uncategorized usage that matches the difference in consumption between the total and the sum of the usages.
This happens when:
- Some usages have not been assigned energy usage types in Energy Hub, or
- Some usages are not monitored, or
- The monitoring devices for some usages do not provide the required energy data (for example kVAh, if Energy mode is set to Apparent energy).
To remove the display of Uncategorized usage:
- Verify that all usages are assigned to an energy usage type for the location.
- Add monitoring devices to your facility for unmonitored usages, or add a virtual device to the panel for this location in Energy Hub and define its energy usage type.
NOTE: Since you can only add one virtual device per panel, the new virtual device represents the sum of all unmonitored usages for this panel.
- Replace the monitoring devices that do not provide the required data with types that do provide it.
Scenario 2:
The total consumption for a location is less than the sum of its usages. Energy Hub shows a negative Uncategorized usage that matches the difference in consumption between the total and the sum of the usages.
This happens when:
- Some energy supplies (incomers) have not been assigned to the Total energy usage type in Energy Hub, or
- Some energy supplies (incomers) are not monitored, or
- The monitoring devices for some energy supplies (incomers) do not provide the required energy data (for example kVAh, if Energy mode is set to Apparent energy).
To remove the display of Uncategorized usage:
- Verify that all energy supplies (incomers) are assigned to the Total energy usage type for the location.
- Add monitoring devices to your facility for unmonitored energy supplies (incomers), or remove all energy supplies (incomers) from the Total energy usage type for this location.
NOTE: Removing all energy supplies (incomers) from the Total energy usage type will cause Energy Hub to calculate the total consumption based on the sum of all the assigned usages, which will remove the display of Uncategorized usage. For more information on the Total energy usage type, see 'Total energy' usage type.
- Replace the monitoring devices that do not provide the required data with types that do provide it.
Example: Scenario 1, positive Uncategorized usage.
Energy Hub displays the following Uncategorized usages for the example above:
| Floor 1 - Uncategorized usage | Floor 2 - Uncategorized usage | Building - Uncategorized usage |
|---|---|---|
|
20 kWh = Floor 1 Total energy − Lighting − HVAC [(70 −10 − 40) kWh = 20 kWh] |
− 10 kWh = Floor 2 Total energy − Lighting − HVAC − Plug loads [(60 − 20 − 40 − 10) kWh = − 10 kWh] |
10 kWh = Building total − Lighting (exterior) − Lighting (interior) − HVAC − Plug loads [(230 − 100 − 30 − 80 − 10) kWh = 10 kWh] |
For more information on energy usage types in Energy Hub, see Loads and supplies.
Consumption monitoring includes the following data:
- Electric energy flow
- Electric energy consumption
- Electric energy consumption by usage type
- Electric energy consumption by location
- Water consumption
- Fuel gas consumption
Energy Hub offers the following software-based alarm types for consumption monitoring:
[Web app]
- Electrical energy overconsumption alarm
- Water overconsumption alarm
- Fuel gas overconsumption alarm
[Mobile app]
- Electrical energy overconsumption alarm
NOTE: Your feature plan subscription, the monitoring device types, and the device configurations determine the types of alarms you can have for your organization. For information on which alarm types are available for different devices and feature plans, see the alarms reference.
To learn more about alarming in Energy Hub, see Alarming.
For details on software-based alarms, see Software-based alarms.
For step-by-step instructions on how to configure software-based alarms and manage alarms in general, see alarming and notification tasks.
Prerequisites
Verify that:
- You have an active Energy Hub subscription that includes this feature. For information on subscriptions, see Energy Hub subscriptions.
- Power monitoring devices are installed in your facility to monitor loads such as lighting, air conditioning, plug loads, and other consumers.
- (For water and gas monitoring) Water and gas monitoring devices are installed in your facility.
- The monitoring devices are connected to communication gateways, for example Site Server or Panel Server, that are sending measurement data to Energy Hub over the internet.
- The communication gateways have been added to your organization in Energy Hub.
NOTE: For Energy Hub to recognize a device as a water or gas meter, set the correct I/O Contextualization setting and the Commodity setting for the device in the Panel Server gateway. You can also set the Commodity setting in Energy Hub if it is not set correctly by Panel server. See Settings for information on the Commodity setting.
Configuration
[Web app]
- Associate the monitoring devices that are monitoring the loads and supplies with the locations in the organization model where these loads and supplies are located. For example, associating a device that is monitoring the lighting loads for floor 1 with the floor 1 location in the organization model.
- Assign usage types to the monitoring device to identify the types of load or supply that are being monitored.
- (Optional) To switch between active energy (kWh) and apparent energy (kVAh) displays, change the Energy mode setting for the monitored location.
[Mobile app]
There is no configuration for consumption in the mobile app.
For step-by-step instructions on these configuration tasks, see energy and commodities consumption monitoring tasks.
[Web app]
You can view consumption in the Energy view in Investigate.
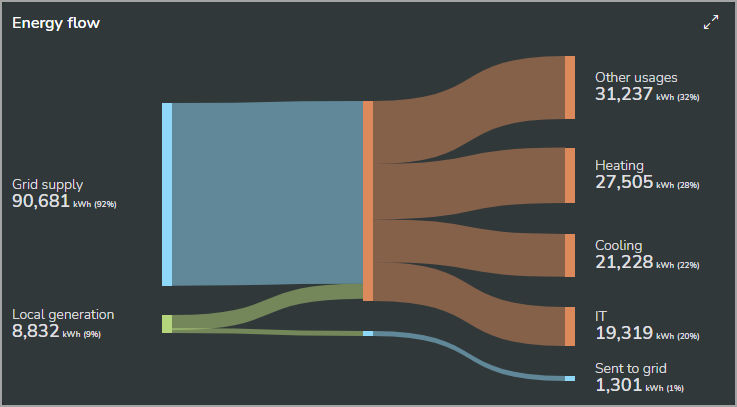
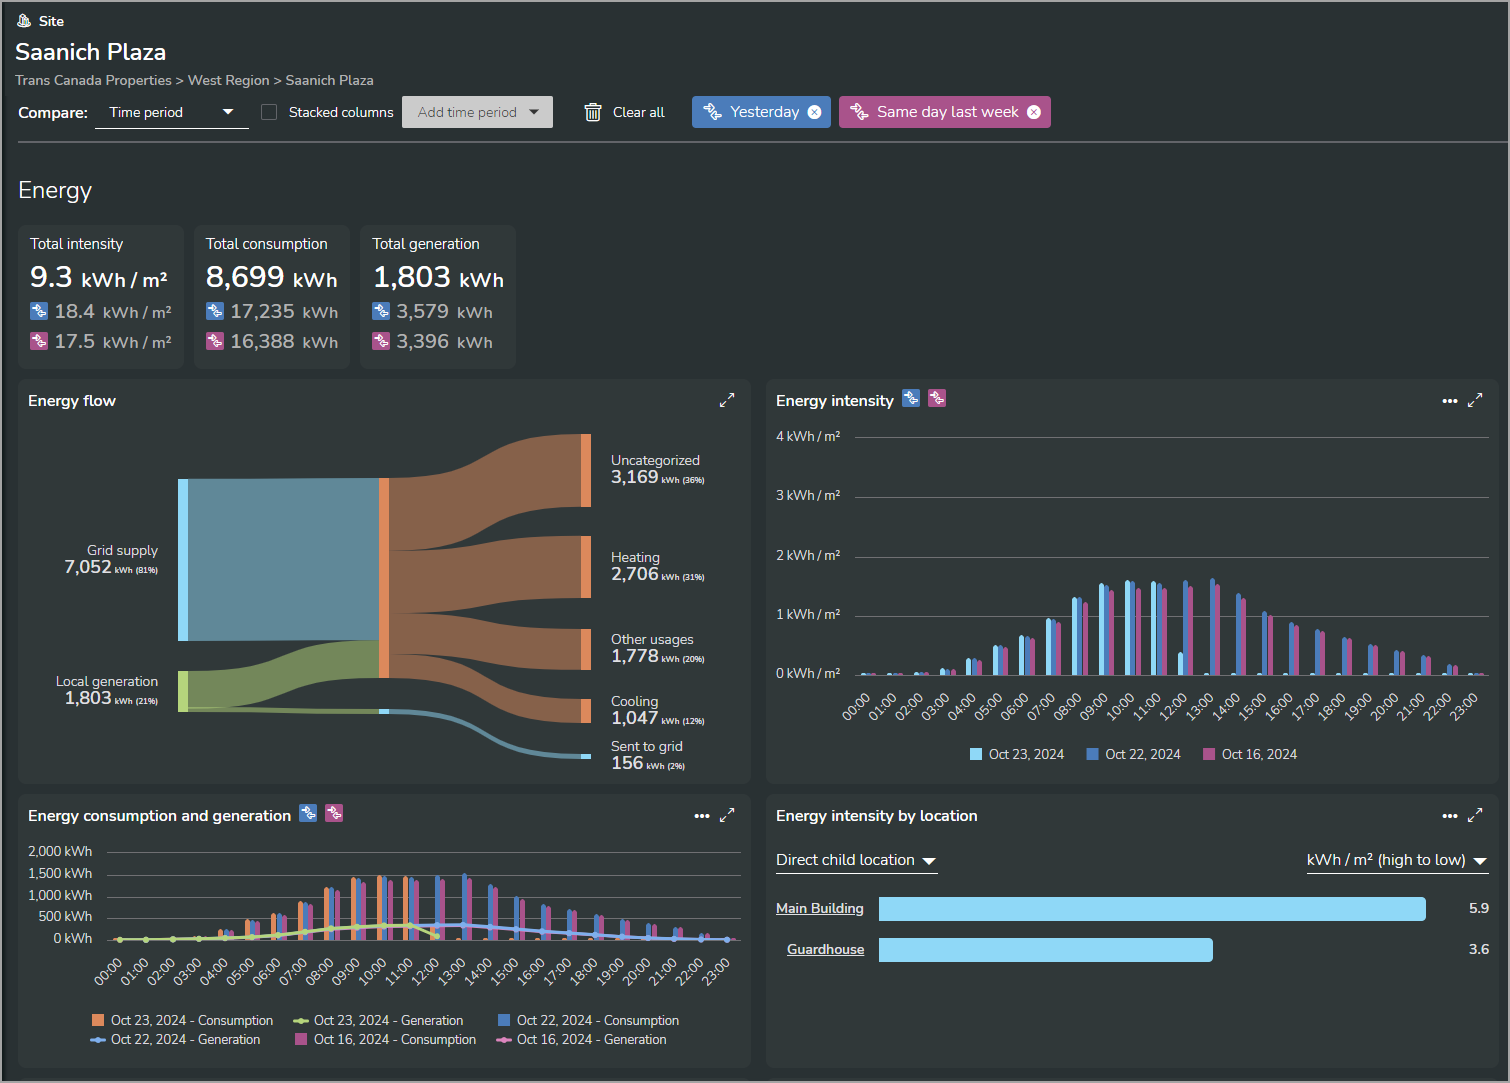
Energy flow (shown in dark mode):
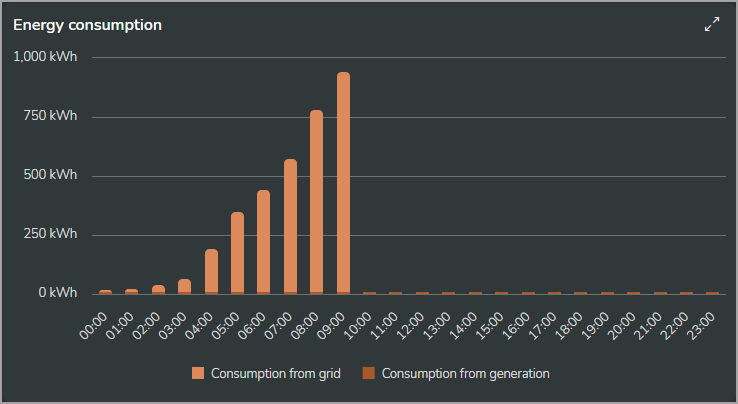
Energy consumption (shown in dark mode):
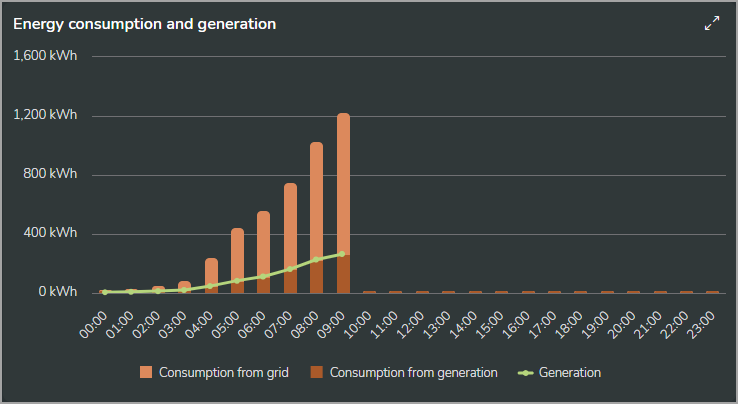
Energy consumption and generation (shown in dark mode):
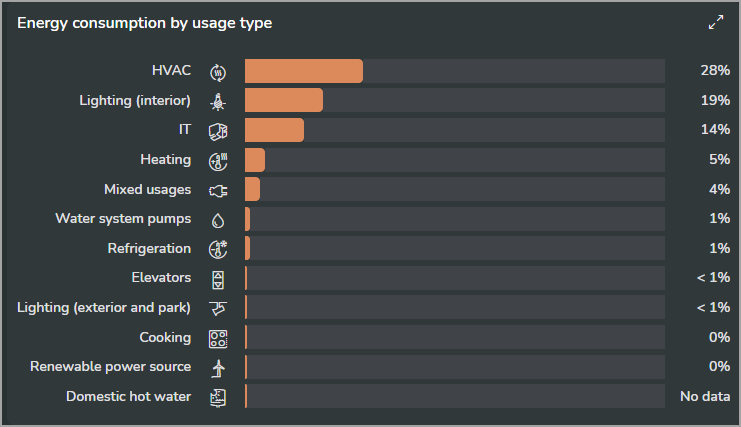
Energy consumption by usage type (shown in dark mode):
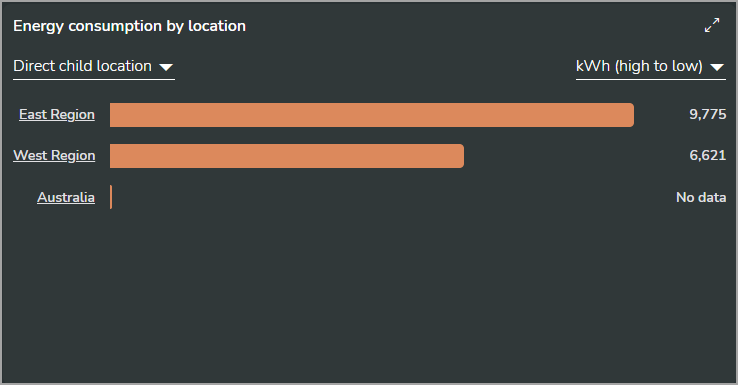
Energy consumption by location (shown in dark mode):
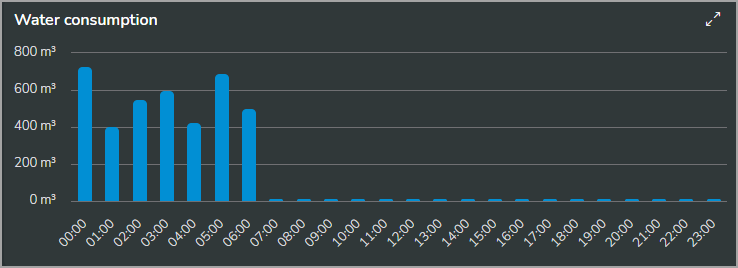
Water consumption (shown in dark mode):
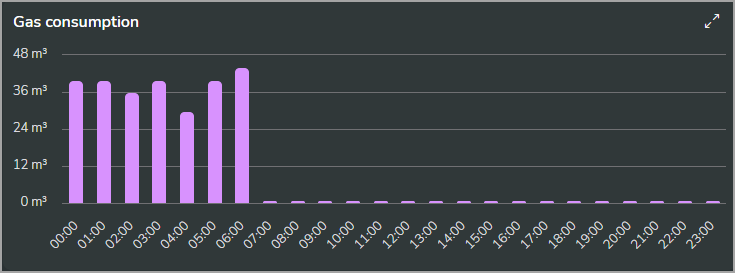
Gas consumption (shown in dark mode):
Energy flow (shown in dark mode):
Energy consumption (shown in dark mode):
Energy consumption and generation (shown in dark mode):
Energy consumption by usage type (shown in dark mode):
Energy consumption by location (shown in dark mode):
Water consumption (shown in dark mode):
Gas consumption (shown in dark mode):
[Mobile app]
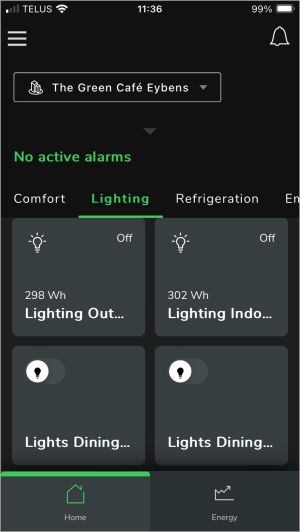
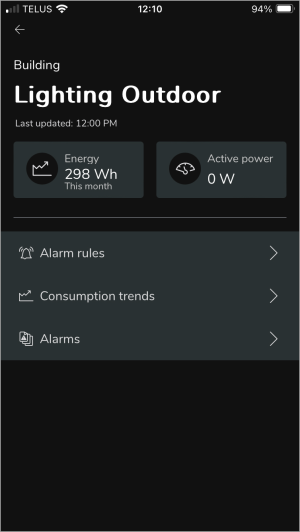
Electrical consumption
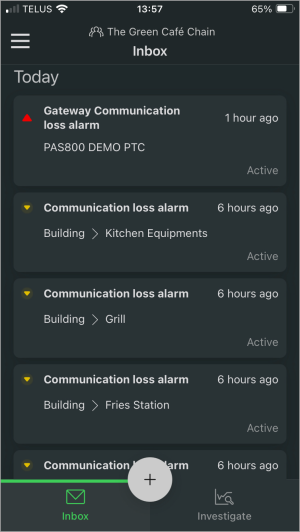
You can view electrical consumption data and alarms in Site manager mode on the Home and Energy tabs and in Technician mode on the Inbox and Investigate tabs.
Water and fuel gas consumption
You can view water and fuel gas consumption in Technician mode on the Investigate tab.
Site manager mode
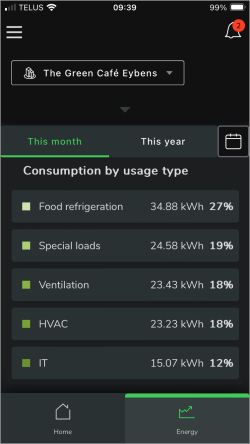
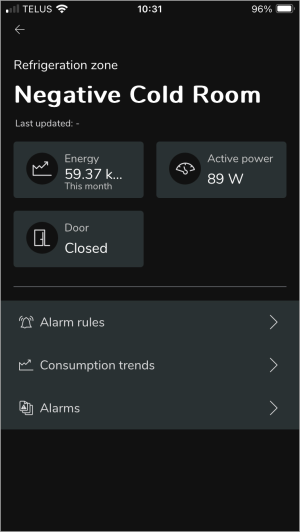
Energy consumption on the Home tab (shown in dark mode):
|
|
Energy consumption on the Energy tab (shown in dark mode):
|
|
|
|
Technician mode
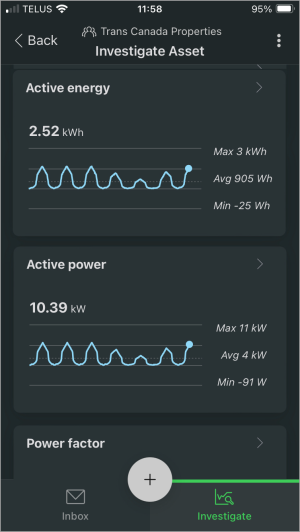
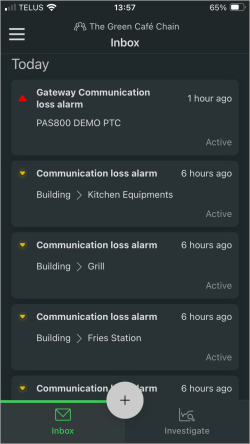
Energy consumption alarms on the Inbox tab and trends on the Investigate tab (shown in dark mode):
|
|
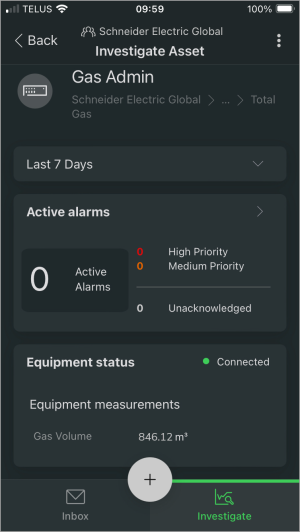
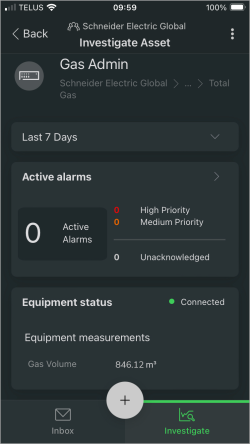
Gas consumption data in equipment status on the Investigate tab (shown in dark mode):
|
Site manager mode
Energy consumption on the Home tab (shown in dark mode):

Energy consumption on the Energy tab (shown in dark mode):


Technician mode
Energy consumption alarms on the Inbox tab and trends on the Investigate tab (shown in dark mode):

Gas consumption data in equipment status on the Investigate tab (shown in dark mode):
|
For step-by-step instructions on how to view consumption, see viewing consumption and demand.
[Web app]
You can create a consumption report by printing the data displays in the Energy view in Investigate, or by saving them as a PDF output. You can also export the data that is used in the displays in CSV file format.
[Mobile app]
There is no reporting for consumption in the mobile app.
For step-by-step instructions on how to report on energy system data, see reporting tasks.
[Web app only]
Consumption by business hours tracks energy consumption based on open hours and closed hours for your business activities or facilities. You can create a business hours schedule, including open hours and closed hours, and special time periods when your business is closed, such as holidays.
Consumption by business hours monitoring includes the following data:
- Electric energy consumption by business hours
There are no software-based alarm types for Consumption by business hours. To learn more about alarming in Energy Hub, see Alarming.
Prerequisites
Verify that:
- You have an active Energy Hub subscription that includes this feature. For information on subscriptions, see Energy Hub subscriptions.
- Power monitoring devices are installed in your facility to monitor loads such as lighting, air conditioning, plug loads, and other consumers.
- The monitoring devices are connected to communication gateways, for example Site Server or Panel Server, that are sending measurement data to Energy Hub over the internet.
- The communication gateways have been added to your organization in Energy Hub.
- Loads and supplies have been configured and usage types have been assigned.
Configuration
Create a business hours schedule for the monitored location.
For step-by-step instructions on this configuration task, see energy and commodities consumption monitoring tasks.
You can view consumption by business hours in the Energy view in Investigate. For step-by-step instructions on how to view consumption, see viewing consumption and demand.
Examples:
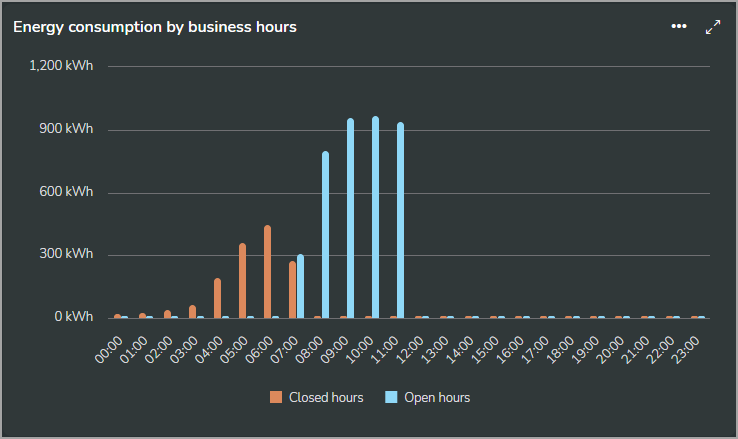
Energy consumption by business hours (shown in dark mode):
Energy consumption by business hours and usage types(shown in dark mode):
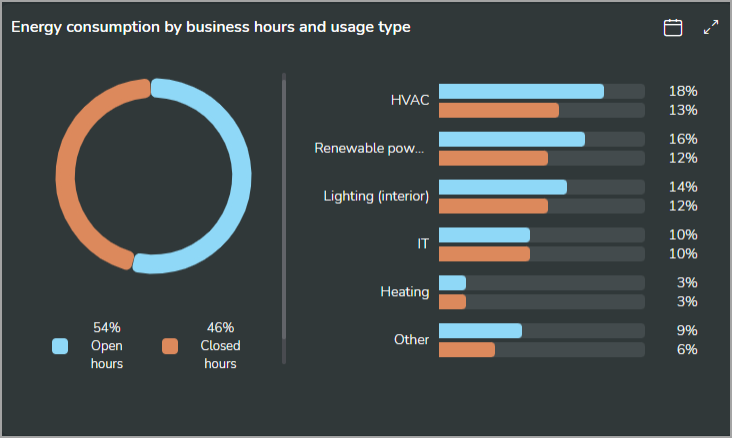
Energy consumption by business hours and usage types(shown in dark mode):

You can create a consumption by business hours report by printing the data displays in the Energy view in Investigate, or by saving them as a PDF output. You can also export the data that is used in the displays in CSV file format. For step-by-step instructions on how to report on energy system data, see reporting tasks.
[Web app only]
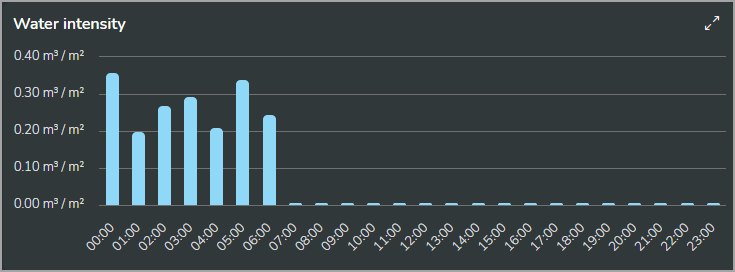
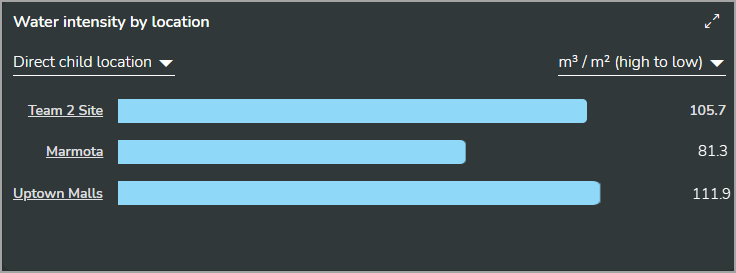
Intensity shows consumption normalized by floor area for a location, such as a building. You can view intensity for different locations and different time ranges.
Floor area
To calculate intensity, Energy Hub needs to know the floor area for the selected location or its child locations.
NOTE: The floor area unit of measurement (ft2 or m2) is determined by the organization settings.
Energy Hub determines floor area like this:
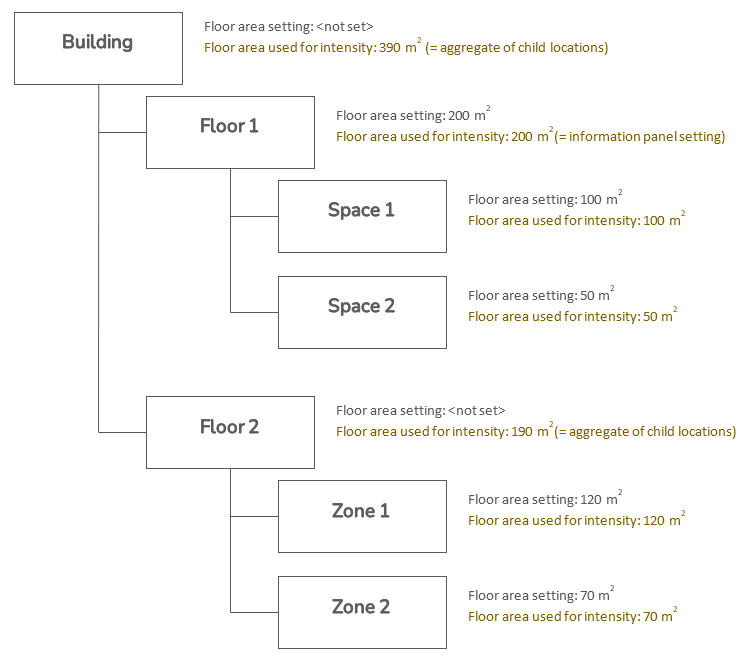
First it tries to use the floor area that is set for a location (organization, region, site, building, ...) in the information panel . If no floor area is set in the information panel, Energy Hub uses the aggregate floor area of the location's direct child locations. It only uses this aggregate if all direct child locations have a floor area defined, or if the floor area for these child locations can be calculated by aggregating their children.
Energy Hub does not display the aggregate child floor area value that is used by a parent in the parent information panel.
A manually entered Floor area value in the parent information panel overrides the aggregate of the child locations. Energy Hub does not add the child aggregate to the manually entered floor area for the parent.
Example: Floor area settings (in information panel) and roll-up aggregation.
Consumption intensity includes the following data:
- Electric energy intensity
- Electric energy intensity by location
- Water intensity
- Water intensity by location
There are no software-based alarm types for Intensity. To learn more about alarming in Energy Hub, see Alarming.
Prerequisites
Verify that:
- You have an active Energy Hub subscription that includes this feature. For information on subscriptions, see Energy Hub subscriptions.
- Power monitoring devices are installed in your facility to monitor loads such as lighting, air conditioning, plug loads, and other consumers.
- (For water monitoring) Water monitoring devices are installed in your facility.
- The monitoring devices are connected to communication gateways, for example Site Server or Panel Server, that are sending measurement data to Energy Hub over the internet.
- The communication gateways have been added to your organization in Energy Hub.
- Loads and supplies have been configured and usage types have been assigned.
NOTE: For Energy Hub to recognize a device as a water meter, set the correct I/O Contextualization setting and the Commodity setting for the device in the Panel Server gateway. You can also set the Commodity setting in Energy Hub if it is not set correctly by Panel server. See Settings for information on the Commodity setting.
Configuration
Set the floor area for the monitored location.
For step-by-step instructions on this configuration task, see energy normalization tasks.
You can view intensity in the Energy view in Investigate. For step-by-step instructions on how to view intensity, see viewing normalized consumption.
Examples:
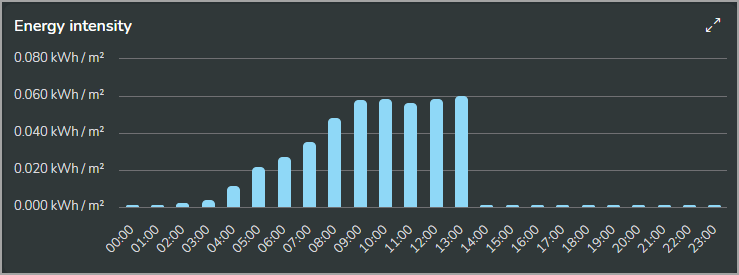
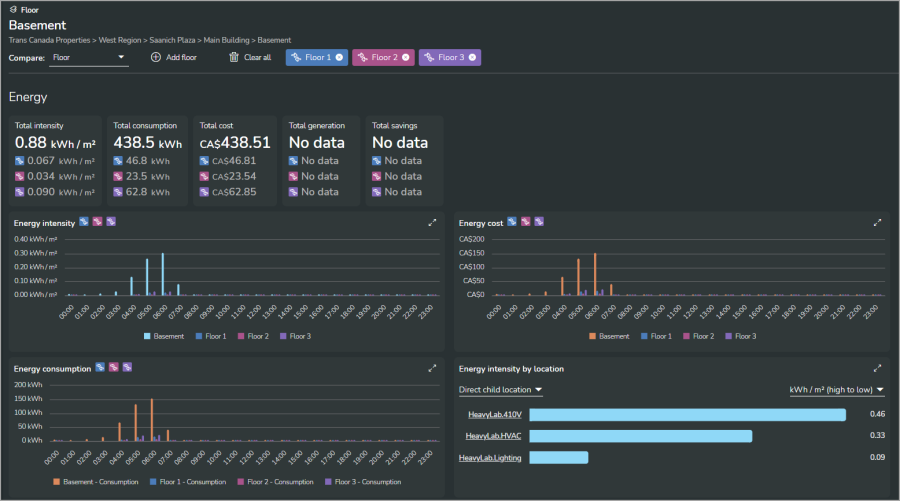
Energy intensity (shown in dark mode):
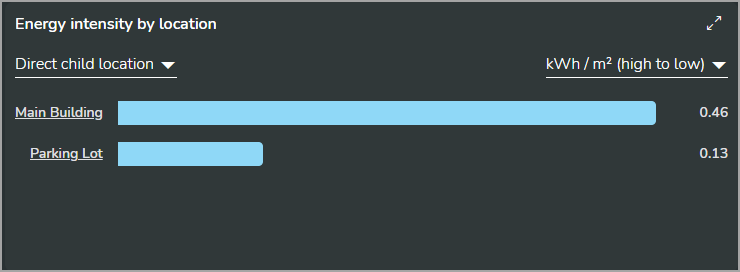
Energy intensity by location (shown in dark mode):
Water intensity (shown in dark mode):
Water intensity by location (shown in dark mode):
Energy intensity (shown in dark mode):
Energy intensity by location (shown in dark mode):
Water intensity (shown in dark mode):
Water intensity by location (shown in dark mode):
You can create an intensity report by printing the data displays in the Energy view in Investigate, or by saving them as a PDF output. You can also export the data that is used in the displays in CSV file format. For step-by-step instructions on how to report on energy system data, see reporting tasks.
[Web app only]
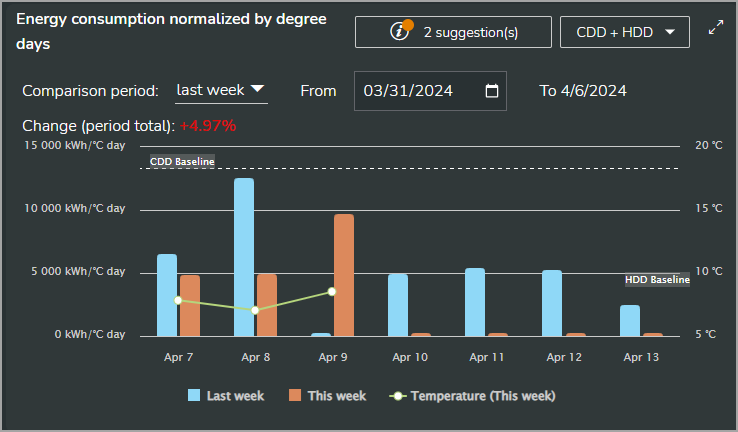
Weather normalization shows electrical energy consumption normalized by degree days. Weather normalization is calculated by dividing the energy consumed for a site or building by the number of degree days for the location. You can view weather normalization for different locations and different time ranges.
Degree day normalization
The normalization in Energy Hub is based on heating degree days (HDD) and cooling degree days (CDD).
HDD and CDD are measures of how much the outside air temperature deviates from a baseline temperature. For example, a high HDD value for a day means that the outside temperature was much below the baseline temperature and that a lot of building heating may have been required for that day. A high CDD value for a day means that the outside temperature was much above the baseline temperature and that a lot of building cooling may have been required for that day.
The baseline temperature is the temperature at which no heating or cooling is required for a building. The baseline temperature depends on the location and building type, and it is different for HDD and CDD .
Energy Hub uses Weatherstack, a third-party world weather service, to get the degree day data for a location based on its street address. The baseline temperatures are country specific. Energy Hub uses the Weatherstack baseline temperatures for a location as a default. You can adjust the baseline temperatures if necessary.
Weather normalization includes the following data:
- Electric energy consumption normalized by degree days
There are no software-based alarm types for Weather normalization. To learn more about alarming in Energy Hub, see Alarming.
Prerequisites
Verify that:
- You have an active Energy Hub subscription that includes this feature. For information on subscriptions, see Energy Hub subscriptions.
- Power monitoring devices are installed in your facility to monitor loads such as lighting, air conditioning, plug loads, and other consumers.
- The monitoring devices are connected to communication gateways, for example Site Server or Panel Server, that are sending measurement data to Energy Hub over the internet.
- The communication gateways have been added to your organization in Energy Hub.
- Loads and supplies have been configured and usage types have been assigned.
Configuration
- Enter a street address for the monitored location. Energy Hub uses the address to get weather data for the location.
- (Optional) Change the baseline temperatures for HDD and CDD.
For step-by-step instructions on these configuration tasks, see energy normalization tasks.
You can view weather normalization in the Energy view in Investigate and for consumption ranking on the Home page. For step-by-step instructions on how to view weather normalization, see viewing normalized consumption.
Examples:
Weather normalized consumption in Investigate (shown in dark mode):
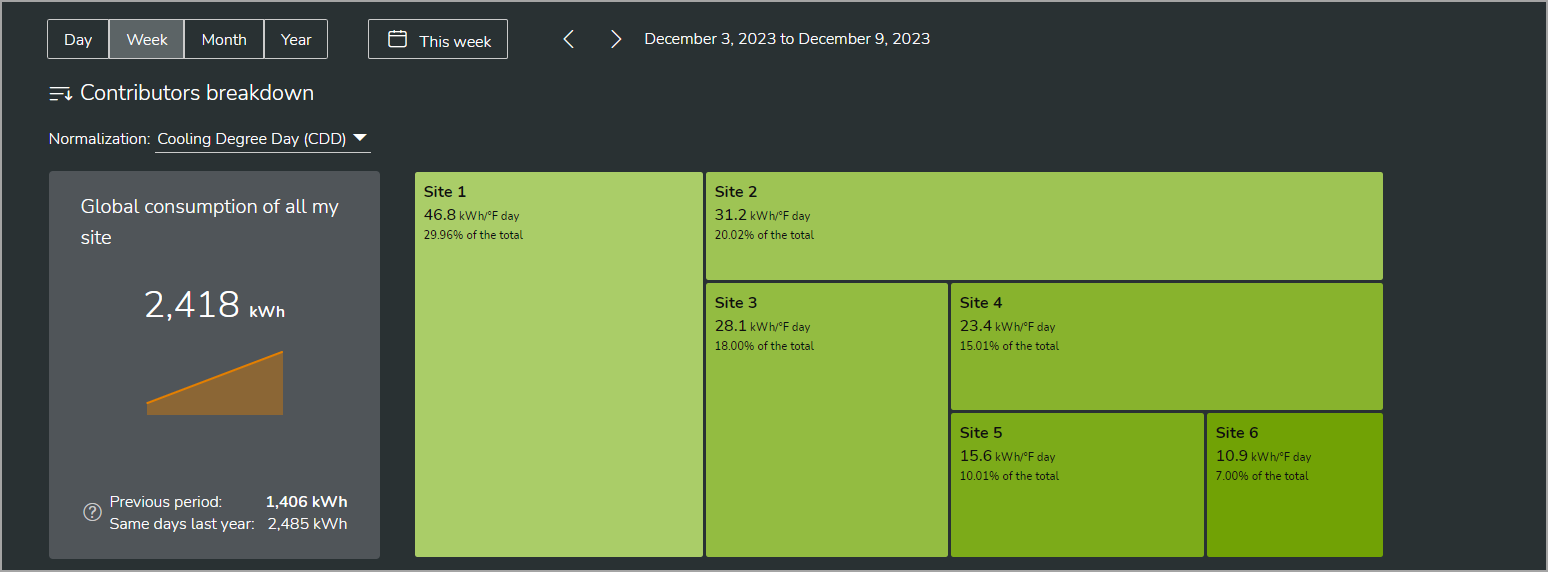
Weather normalized consumption ranking on Home page (shown in dark mode):
Weather normalized consumption ranking on Home page (shown in dark mode):
You can create a weather normalization report by printing the data displays in the Energy view in Investigate, or by saving them as a PDF output. You can also export the data that is used in the displays in CSV file format. For step-by-step instructions on how to report on energy system data, see reporting tasks.
[Web app only]
Consumption comparison compares electrical energy and commodity (water, fuel gas) consumption over time or for different locations, loads, and equipment. You can compare trends and totals for electrical consumption, generation, intensity, and demand.
Comparison over time
Compare energy and commodity consumption for a location or a piece of equipment for different time periods. You select the reference time period with the date range selector in the Investigate toolbar. The comparison time periods are selected with the time period selector in the header of the Investigate display panel. For details on the comparison time period selector, see Comparison time selector.
Comparison between locations, loads, and equipment
Compare energy and commodity consumption for different locations, loads, and equipment for a given time period. You select the time period with the date range selector in the Investigate toolbar. The locations, loads, and equipment to compare are selected from the organization tree in the navigation panel. You can only compare items of the same type, for example, sites with sites, buildings with buildings, panels with panels.
NOTE: You can do a maximum of 10 comparisons at one time.
Consumption comparison includes the following data:
- Electric energy consumption
- Electric energy intensity
- Electric demand
- Water consumption
- Water intensity
- Fuel gas consumption
There are no software-based alarm types for Consumption comparison. To learn more about alarming in Energy Hub, see Alarming.
Prerequisites
Verify that:
- You have an active Energy Hub subscription that includes this feature. For information on subscriptions, see Energy Hub subscriptions.
- Power monitoring devices are installed in your facility to monitor loads such as lighting, air conditioning, plug loads, and other consumers.
- The monitoring devices are connected to communication gateways, for example Site Server or Panel Server, that are sending measurement data to Energy Hub over the internet.
- The communication gateways have been added to your organization in Energy Hub.
- Loads and supplies have been configured and usage types have been assigned.
Configuration
For intensity comparisons, set the floor area for the locations you want to compare.
For step-by-step instructions on these configuration tasks, see energy and commodities consumption monitoring tasks.
You can view consumption comparison in the Energy view in Investigate. For step-by-step instructions on how to view and use consumption comparisons, see viewing consumption and demand.
TIP: To activate comparison mode, select the comparison type (Time period or location) and add comparison time periods, locations, or equipment to the display.
Examples:
Comparison over time (shown in dark mode):

Comparison for locations (shown in dark mode):
Comparison for locations (shown in dark mode):

You can create a consumption comparison report by printing the data displays in the Energy view in Investigate, or by saving them as a PDF output. You can also export the data that is used in the displays in CSV file format. For step-by-step instructions on how to report on energy system data, see reporting tasks.
[Web app and mobile app]
Demand shows electrical power demand and peak demand. For peak demand, it identifies the contributing coincident demands for the different energy usage types. You can view demand trends for different loads and different date ranges.
NOTE: The mobile app shows power instead of demand.
- Electric demand
- Electric power
Energy Hub offers the following software-based alarm types for demand monitoring:
[Web app]
- Over peak demand alarm
[Mobile app – Site Manager mode only]
- Active power (over/under) alarm
NOTE: Your feature plan subscription, the monitoring device types, and the device configurations determine the types of alarms you can have for your organization. For information on which alarm types are available for different devices and feature plans, see the alarms reference.
To learn more about alarming in Energy Hub, see Alarming.
For details on software-based alarms, see Software-based alarms.
For step-by-step instructions on how to configure software-based alarms and manage alarms in general, see alarming and notification tasks.
Prerequisites
Verify that:
- You have an active Energy Hub subscription that includes this feature. For information on subscriptions, see Energy Hub subscriptions.
- Power monitoring devices are installed in your facility to monitor loads such as lighting, air conditioning, plug loads, and other consumers.
- The monitoring devices are connected to communication gateways, for example Site Server or Panel Server, that are sending measurement data to Energy Hub over the internet.
- The communication gateways have been added to your organization in Energy Hub.
- Loads and supplies have been configured and usage types have been assigned.
Configuration
No configuration is required for demand.
[Web app]
You can view demand and peak demand in the Energy view in Investigate.
Demand and peak demand (shown in dark mode):
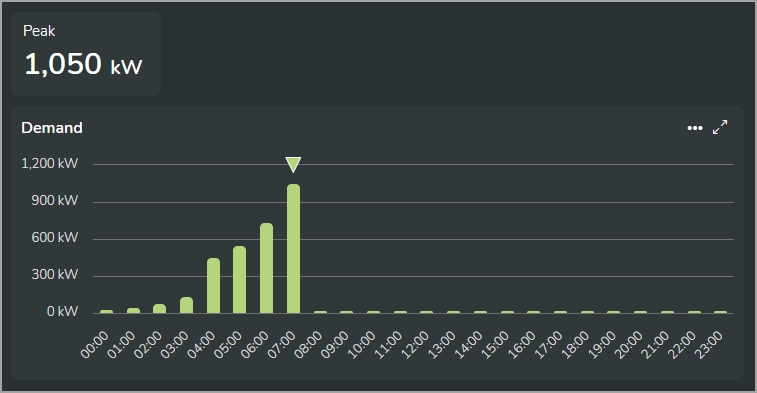
Demand and peak demand (shown in dark mode):
[Mobile app]
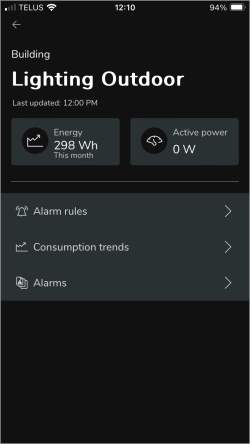
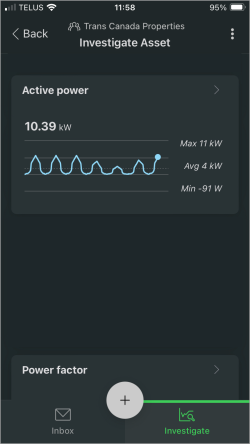
You can view power in Site manager mode on the Home tab, and in Technician mode on the Investigate tab.
Electrical power in Site manager mode and Technician mode (shown in dark mode):
|

|
Electrical power in Site manager mode and Technicianmode (shown in dark mode):

For step-by-step instructions on how to view demand, see viewing consumption and demand.
[Web app]
You can create a demand report by printing the data displays in the Energy view in Investigate, or by saving them as a PDF output. You can also export the data that is used in the displays in CSV file format.
[Mobile app]
There is no reporting for power in the mobile app.
For step-by-step instructions on how to report on demand, see reporting tasks.
[Web app and mobile app]
Energy performance shows selected indicators
[Web app]
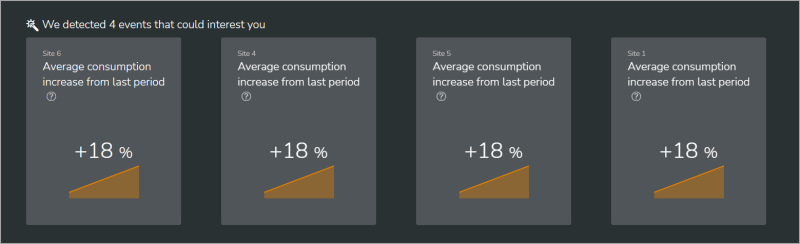
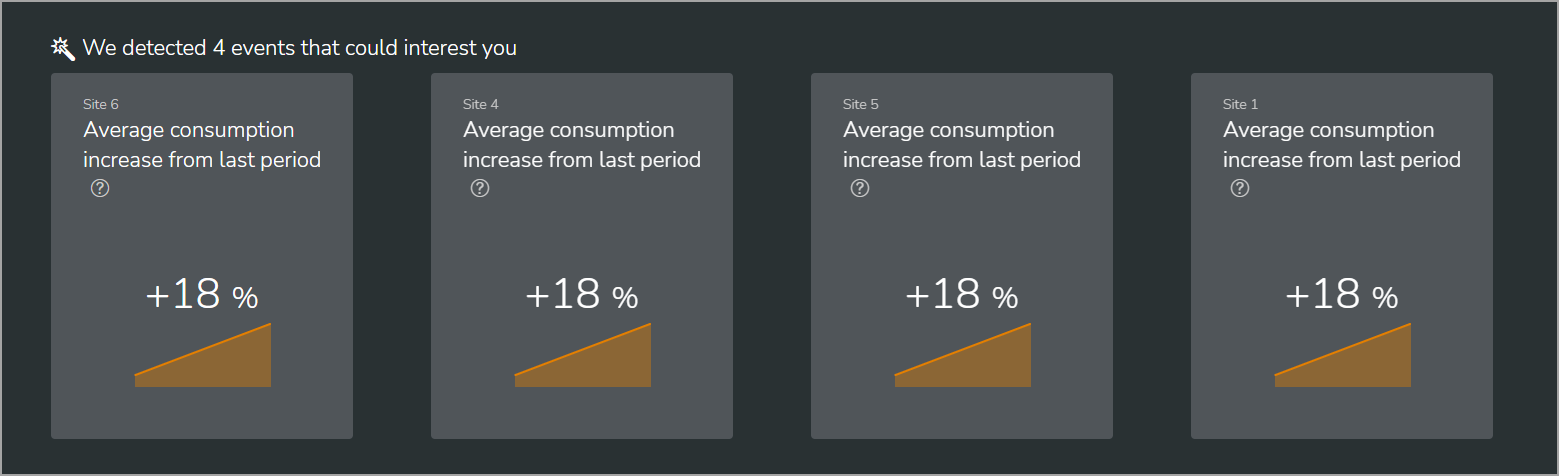
Insights and recommendations
Energy Hub highlights significant changes in the energy consumption patterns of the organization. These changes could suggest inefficiencies with equipment operation, operations schedules, or user behavior. Investigating and improving these inefficiencies could present opportunities for service improvements as well as energy and cost savings.
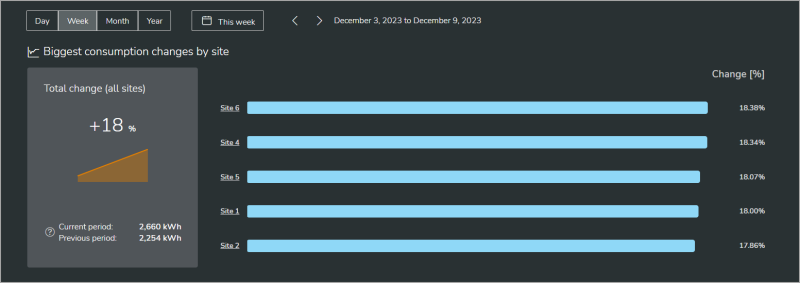
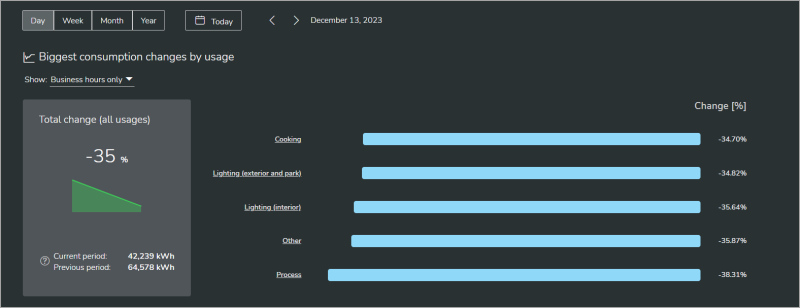
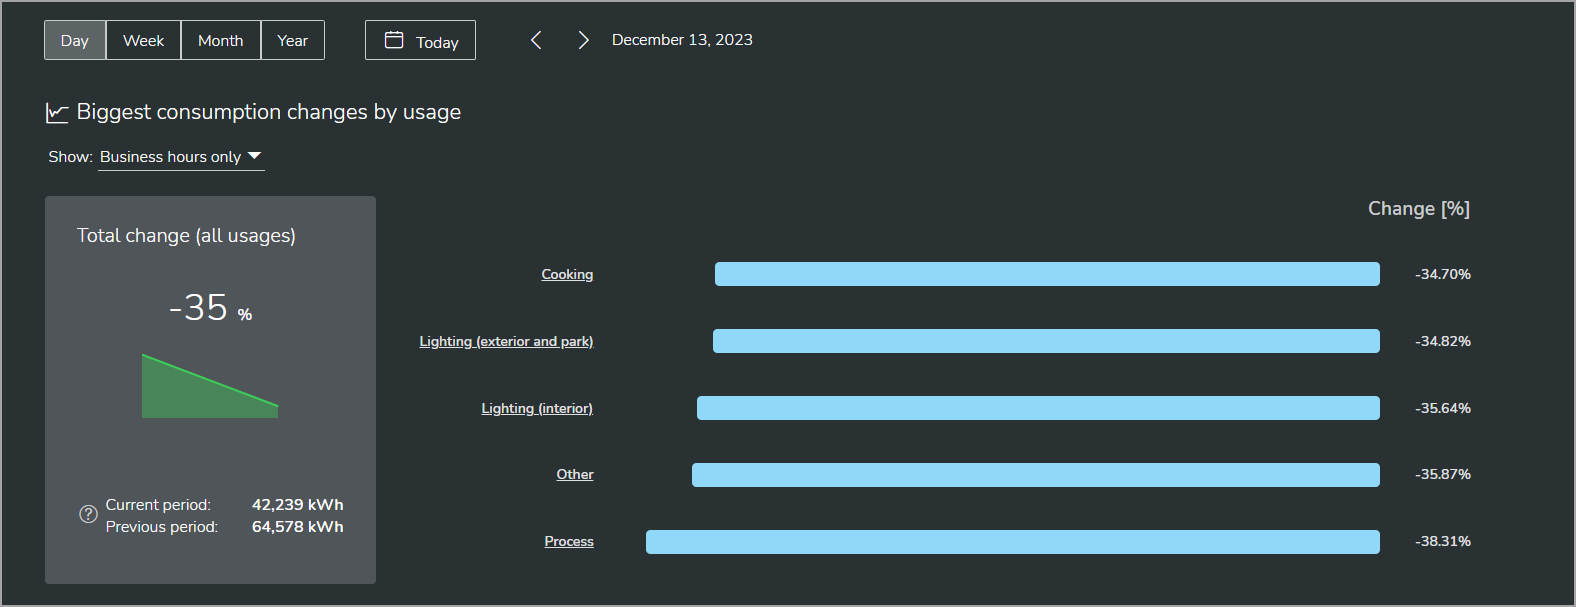
Consumption trends
Energy Hub displays the sites or the energy usage types with the biggest period over period changes in energy consumption. For organizations with multiple sites, it shows consumption by site; for organizations with a single site, it shows consumption by energy usage type.
For energy usage type displays, you can view the consumption changes for the whole selected time period, for business hours only, or for closed hours only.
The comparison is between the current period, set by the date range selector on the page, and the preceding period of the same duration. For example, a current period of "today" is compared to "yesterday", a current period of "this week" is compared to "last week".
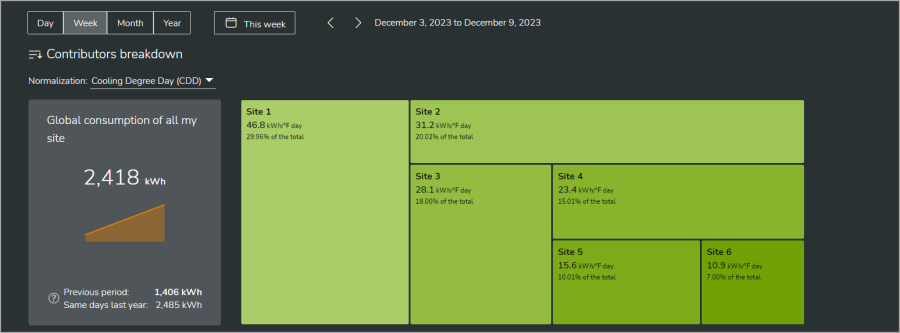
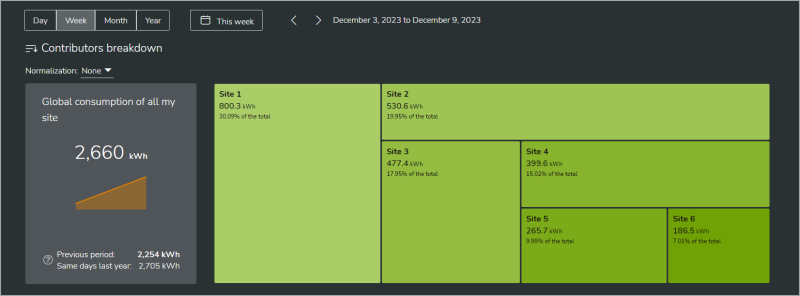
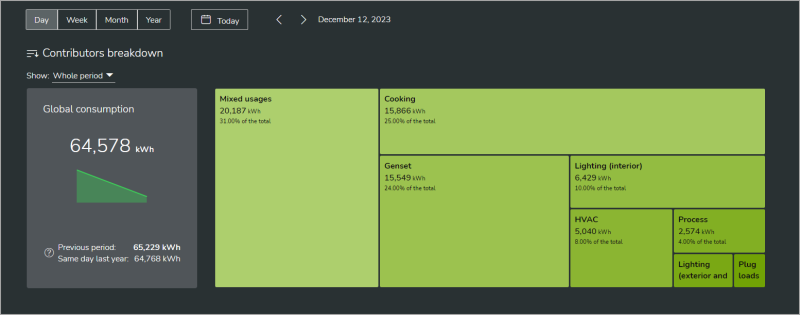
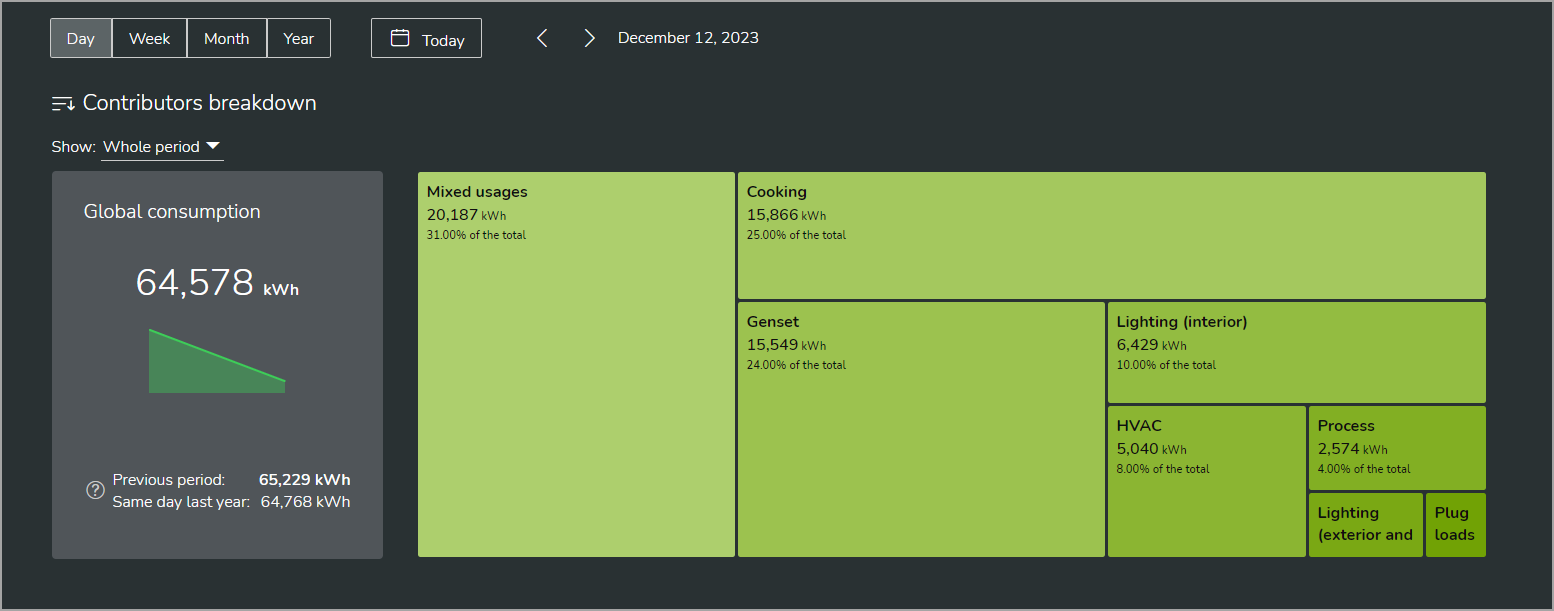
Consumption ranking
Energy Hub displays the energy consumption for the organization by site or by energy usage type, from highest to lowest consumption. For organizations with multiple sites, it shows consumption by site; for organizations with a single site, it shows consumption by energy usage type.
For site displays, you can view actual consumption or consumption normalized by floor area, cooling degree days (CDD), heating degree days (HDD), or both CDD + HDD.
For energy usage type displays, you can view the consumption for the whole selected time period, for business hours only, or for closed hours only. The time period for the comparison is set by the date range selector on the page.
Consumption tracking
Energy Hub compares the monthly energy consumption for a site with its target. The time period for the comparison is set by the date range selector on the page.
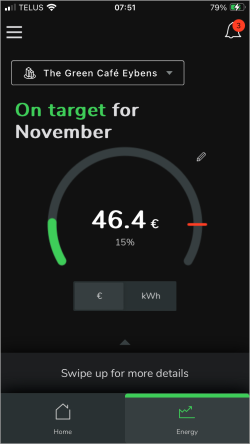
[Mobile app]
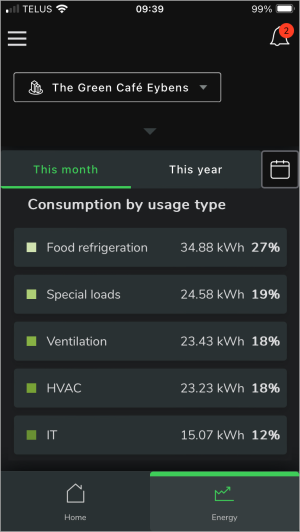
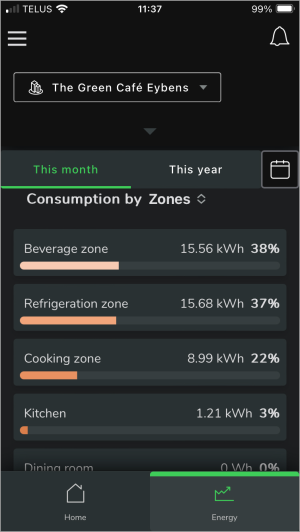
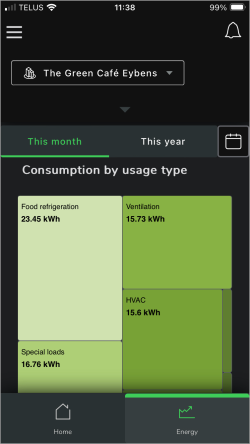
Consumption ranking
Energy Hub displays energy consumption by location (site, building, floor, area, space, zone) and by energy usage type, from highest to lowest consumption.
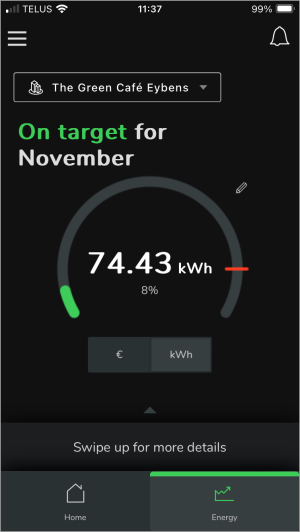
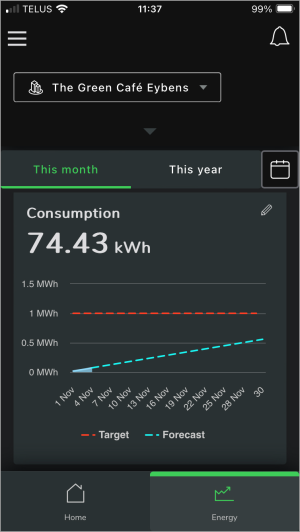
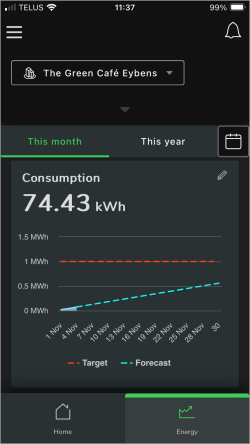
Consumption tracking
Energy Hub compares energy consumption for a site with its target. The time period for the comparison is set by a date range selector on the screen.
Energy performance includes the following data:
- Electric energy consumption
- Electric energy consumption by usage type
- Electric energy consumption by location
Energy Hub offers the following software-based alarm types for energy performance:
- Electrical energy overconsumption alarm
NOTE: Your feature plan subscription, the monitoring device types, and the device configurations determine the types of alarms you can have for your organization. For information on which alarm types are available for different devices and feature plans, see the alarms reference.
To learn more about alarming in Energy Hub, see Alarming.
For details on software-based alarms, see Software-based alarms.
For step-by-step instructions on how to configure software-based alarms and manage alarms in general, see alarming and notification tasks.
Prerequisites
Verify that:
- You have an active Energy Hub subscription that includes this feature. For information on subscriptions, see Energy Hub subscriptions.
- Power monitoring devices are installed in your facility to monitor loads such as lighting, air conditioning, plug loads, and other consumers.
- The monitoring devices are connected to communication gateways, for example Site Server or Panel Server, that are sending measurement data to Energy Hub over the internet.
- The communication gateways have been added to your organization in Energy Hub.
- Loads and supplies have been configured and usage types have been assigned.
Configuration
[Web app]
- For consumption tracking, set consumption targets for your sites.
- For consumption ranking normalization by floor area, set the floor area for the monitored location
- For consumption ranking normalization by heating or cooling degree days, set the street address of the monitored site. Energy Hub uses the address to get weather data for the location.
- For consumption ranking by business hours, create a business hours schedule for the monitored site.
[Mobile app]
For consumption tracking, set consumption targets for your sites.
For step-by-step instructions on these configuration tasks, see energy and commodities consumption monitoring tasks.
[Web app]
You can view energy performance information on the Home page.
Insights and recommendations (shown in dark mode):
Consumption trends for a multi-site organization (shown in dark mode):
Consumption trends for a single-site organization (shown in dark mode):
Consumption ranking for a multi-site organization (shown in dark mode):
Consumption ranking for a single-site organization (shown in dark mode):
Consumption tracking (shown in dark mode):
![]()
Insights and recommendations (shown in dark mode):
Consumption trends for a multi-site organization (shown in dark mode):

Consumption trends for a single-site organization (shown in dark mode):
Consumption ranking for a multi-site organization (shown in dark mode):

Consumption ranking for a single-site organization (shown in dark mode):
Consumption tracking (shown in dark mode):
![]()
[Mobile app – Site Manager mode only]
You can view energy performance information on the Energy tab.
Consumption ranking by energy usage type or location(shown in dark mode):

|
|
Consumption tracking (shown in dark mode):
|
|
|
Consumption ranking by energy usage type or location(shown in dark mode):
Consumption tracking (shown in dark mode):
For step-by-step instructions on how to view energy performance, see To view energy performance information.
There is no reporting for energy performance.
[Web app only]
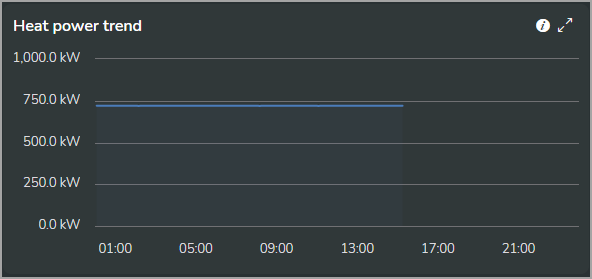
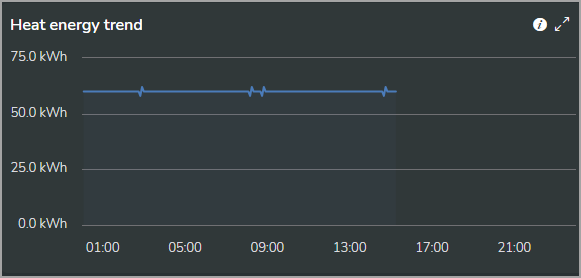
Heat energy monitoring tracks the energy of hot water heating systems in your facility. You can view heat power and heat energy totals and trends.
Heat energy and heat power are calculated and displayed in kWh and kW and are based on kWh pulse counts from water heat monitoring devices.
NOTE: You cannot set software alarms for heat energy and heat power.
Heat energy includes the following data:
- Heat energy (measured in kWh)
- Heat power (measured in kW)
There are no software-based alarm types for Heat energy. To learn more about alarming in Energy Hub, see Alarming.
Prerequisites
Verify that:
- You have an active Energy Hub subscription that includes this feature. For information on subscriptions, see Energy Hub subscriptions.
- Water heat monitoring devices that produce kWh energy pulses are installed in your facility to monitor the hot water heating systems.
- The monitoring devices are connected to communication gateways, for example Site Server or Panel Server, that are sending measurement data to Energy Hub over the internet.
- The communication gateways have been added to your organization in Energy Hub.
Configuration
The Commodity setting for water heat monitoring devices must be set to Water in Energy Hub. The Commodity is set automatically, based on the gateway setting, when a device is first added to the system. Verify that it is set to Water for all heat monitoring devices. If it is not set to Water, set it to Water manually in the device settings in Energy Hub.
For step-by-step instructions on how to edit device settings, see To edit device settings.
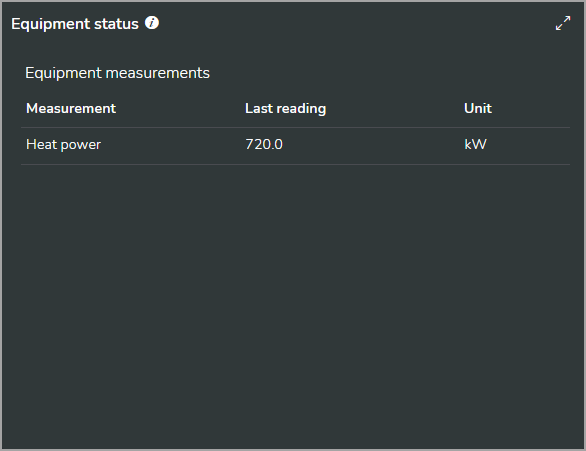
You can view heat energy and heat power in the Asset view in Investigate. For step-by-step instructions on how to view heat energy and heat power, see To view heat power and heat energy.
NOTE: Heat energy and heat power are displayed in Asset view, not Energy view.
Examples:
Heat power status (shown in dark mode):
Heat power trend (shown in dark mode):
Heat energy trend (shown in dark mode):
Heat power trend (shown in dark mode):
Heat energy trend (shown in dark mode):
You can create a heat energy report by printing the data displays in the Asset view in Investigate, or by saving them as a PDF output. CSV export is not available for equipment status displays. For step-by-step instructions on how to report on energy system data, see reporting tasks.
[Web app and mobile app]
Cost tracking shows the cost for electrical energy, water, and fuel gas consumption based on configurable tariffs for the web application and fixed rate charges for the mobile app. You can view cost for different sites and different time ranges. Different sites in the organization can use different tariffs. The same currency is used for all sites.
NOTE: Cost tracking only provides cost estimates for energy
| Cost details |
| Tariffs |
Cost details
[Web app only]
Depending on the types of consumption you are monitoring and the presence of on-site generation, Energy Hub can show the following cost information:
Summary
Total cost
This includes the cost of electricity, water, and gas. It is an estimate of the cost you have to pay to your electricity and commodity suppliers.
Local generation savings
The amount of money saved by using locally generated electricity. This amount would have been added to your total cost if you did not have on-site generation.
Grid sell-back credits
The amount of money or credits earned by selling locally generated electricity to your electricity provider.
NOTE: Sell-back credit calculations are based on the Electricity sell-back rate setting in the information panel for a site, not on the tariff assigned to the site.
Electricity
Total cost
The cost for your electricity consumption.
Local generation savings
The amount of money saved by using locally generated electricity.
Grid sell-back credits
The amount of money or credits earned by selling locally generated electricity to your electricity provider.
NOTE: Sell-back credit calculations are based on the Electricity sell-back rate setting in the information panel for a site, not on the tariff assigned to the site.
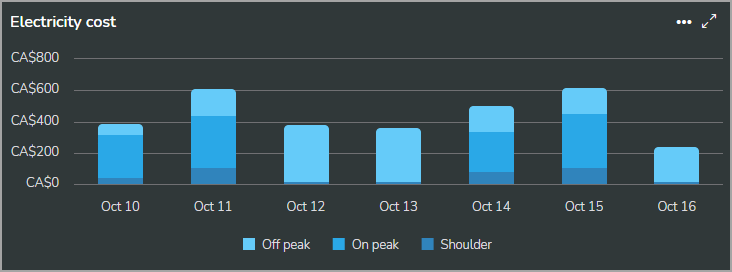
Cost per time-of-use period
The cost for your electricity consumption allocated to time-of-use periods, for example, on-peak cost and off-peak cost
Water
Total cost
The cost for your water consumption.
Gas
Total cost
The cost for your fuel gas consumption.
Tariffs
[Web app only]
A tariff is the pricing structure used to bill customers for the consumption of electricity, water, or gas. In Energy Hub, tariffs are used to estimate the cost of electricity, water, and gas consumption for your facility. The following applies to tariffs in Energy Hub:
- A tariff is defined at the organization level and is not site specific.
- A tariff is assigned to a site.
- A tariff has an effective date that sets the start date from when the tariff is active.
- More than one tariff can be assigned to a site for different date ranges.
- The same tariff can be used for more than one site.
- Energy Hub supports flat-rate tariffs and time-of-use tariffs.
A flat-rate tariff is a single-rate tariff that applies to all days and times in the rate period. Flat-rate tariffs have the following parameters:
- Commodity
- Unit
- Rates
Commodity
The commodity shows if the tariff is used for electricity, water, or gas. A tariff can only be used for one commodity.
Unit
The unit shows the consumption measurement that is used for the tariff, for example m3 for water and gas. For electricity tariffs you can choose between active energy (kWh) and apparent energy (kVAh).
IMPORTANT: When selecting an electricity tariff for a site, verify that the unit (energy type) of the tariff matches the energy type used by the site.
Rates
A rate determines the cost of the commodity per unit of consumption. For example, for electricity, a rate could be 0.25 $/kWh.
A time-of-use tariff is a variable rate tariff that is based on the day and the time of consumption. Time-of-use tariffs have the following parameters:
- Commodity
- Unit
- Time-of-use seasons
- Time-of-use periods
- Special days
- Rates
Commodity
The commodity shows if the tariff is used for electricity, water, or gas. A tariff can only be used for one commodity.
Unit
The unit shows the consumption measurement that is used for the tariff, for example m3 for water and gas. For electricity tariffs you can choose between active energy (kWh) and apparent energy (kVAh).
IMPORTANT: When selecting an electricity tariff for a site, verify that the unit (energy type) of the tariff matches the energy type used by the site.
Time-of-use seasons
A time-of-use season defines a date range. For example, a Spring season could have a date range of March 1 – May 31. Seasons are used to define rates for specific date ranges. A tariff can have one or more seasons.
When configuring time-of-use seasons in Energy Hub, there is a Remaining season that includes all days not covered by the seasons you create. If you do not create any seasons, the Remaining season will cover the entire year. The Remaining season functions like any other season you create, meaning you can include it when setting up rates. You can also rename it. For example, if you create a "Summer" season, you can rename the Remaining season to represent the second season, like "Winter."
Time-of-use periods
A time-of-use period defines time-of-day ranges for one or more days of the week or special days. For example, an On-peak period could be defined as 16:00–21:00 on Monday–Friday. Periods are used to define rates for specific days of the week and times of the day. A tariff can have one or more periods.
When configuring time-of-use periods in Energy Hub, there is a Remaining period that includes all weekdays and times not covered by the periods you create. If you do not create any periods, the Remaining period will cover all days. The Remaining period functions like any other period you create, meaning you can include it when setting up rates. You can also rename it.
Special days
A special day defines a particular day of the year. For example, a New Year's Day special day could be defined as January 1, 2025. Special days are used to define rates for specific days of the year. Defining special days for a tariff is optional. A tariff can have zero or more special days.
NOTE: Special days are defined for a particular year, for example, a New Year's Day special day for 2025 is only valid in that year. To use the same day in a different year, for example in 2026, you need to define a new special day for the new year's day in 2026.
Rates
A rate determines the cost of the commodity per unit of consumption for a certain day and time. For example, for electricity, a rate could be defined as 0.25 $/kWh for the Spring season On-peak period. A tariff can have one or more rates for different seasons and periods.
Cost includes the following data:
- Electric energy consumption cost
- Water consumption cost
- Fuel gas consumption cost
- Total consumption cost (electricity, water, gas)
- Electricity, water, and gas cost flow
There are no software-based alarm types for cost tracking.
To learn more about alarming in Energy Hub, see Alarming.
For details on software-based alarms, see Software-based alarms.
Prerequisites
Verify that:
- You have an active Energy Hub subscription that includes this feature. For information on subscriptions, see Energy Hub subscriptions.
- Power monitoring devices are installed in your facility to monitor loads such as lighting, air conditioning, plug loads, and other consumers.
- (For water and gas monitoring) Water and gas monitoring devices are installed in your facility.
- The monitoring devices are connected to communication gateways, for example Site Server or Panel Server, that are sending measurement data to Energy Hub over the internet.
- The communication gateways have been added to your organization in Energy Hub.
- Loads and supplies have been configured and usage types have been assigned.
NOTE: For Energy Hub to recognize a device as a water or gas meter, set the correct I/O Contextualization setting and the Commodity setting for the device in the Panel Server gateway. You can also set the Commodity setting in Energy Hub if it is not set correctly by Panel server. See Settings for information on the Commodity setting.
Configuration
[Web app]
- If no tariffs exist for your organization, create at least one tariff for the commodity you want to monitor cost for.
- Assign tariffs to the sites you want to monitor cost for.
[Mobile app]
Set electricity rates for the sites you want to monitor cost for.
For step-by-step instructions on these configuration tasks, see energy cost tracking tasks.
[Web app]
You can view cost in the Cost view in Investigate.
NOTE: You can only view cost at the site level.
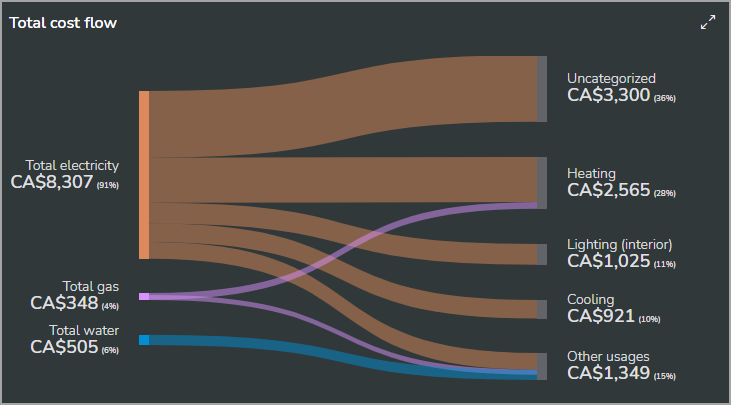
Consumption cost flow (shown in dark mode):
NOTE: Costs are rounded to whole numbers in the cost flow diagram if any displayed cost exceeds 500.
Electricity cost for time-of-use tariff (shown in dark mode):
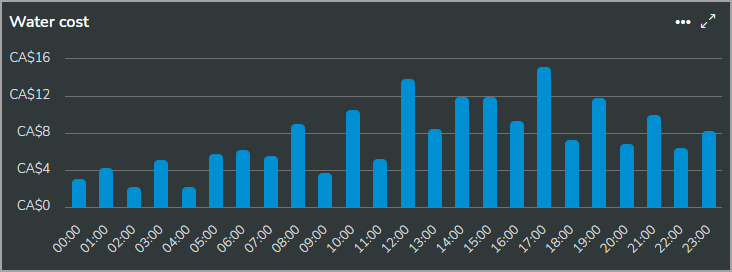
Water cost for flat rate tariff (shown in dark mode):
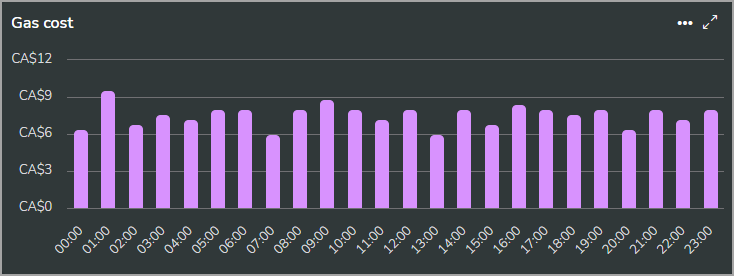
Fuel gas cost for flat rate tariff (shown in dark mode):
Consumption cost flow (shown in dark mode):
Electricity cost for time-of-use tariff (shown in dark mode):
Water cost for flat rate tariff (shown in dark mode):
Fuel gas cost for flat rate tariff (shown in dark mode):
[Mobile app – Site Manager mode only]
You can view cost information for electrical energy consumption on the Energy tab.
NOTE: Information on water and fuel gas consumption cost is not available in the mobile app.
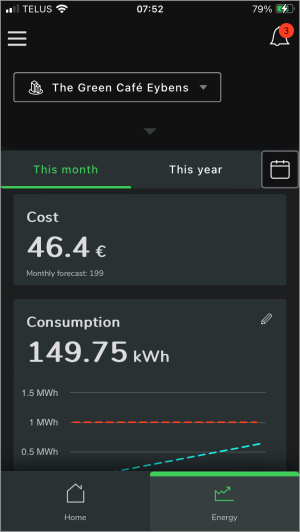
Site energy consumption cost tracking (shown in dark mode):

|
|
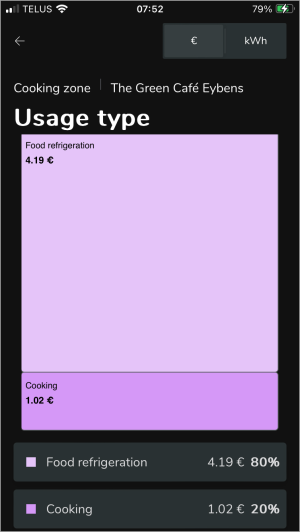
Cost by zone and energy usage type (shown in dark mode):
|
Site energy consumption cost tracking (shown in dark mode):

Cost by zone and energy usage type (shown in dark mode):

|
For step-by-step instructions on how to view cost, see viewing cost.
[Web app]
You can create a cost report by printing the data displays in the Cost view in Investigate, or by saving them as a PDF output. CSV export is not available for cost displays.
[Mobile app]
There is no reporting for cost in the mobile app.
For step-by-step instructions on how to report on energy system data, see reporting tasks.
[Web app and mobile app]
Standards-based monitoring aligns the monitoring and reporting of building energy consumption with established energy efficiency codes and standards. Use it to help you meet your energy efficiency goals and to operate your facilities within expected performance limits.
Supported standards
NOTE: The NABERS rating functionality in Energy Hub is only available in the web app.
Energy Hub is aligned with the following energy efficiency codes and standards:
| Standard | Description |
|---|---|
|
ASHRAE Standard 90.1 |
ANSI/ASHRAE/IES Standard 90.1: Energy Standard for Buildings Except Low-Rise Residential Buildings provides minimum requirements for energy efficient designs for buildings. |
|
California Energy Code (Title 24) |
Title 24 is a collection of energy standards for California buildings. Its goal is to promote energy efficiency in new and existing buildings. |
|
International Energy Conservation Code (IECC) |
The IECC is a building code created by the International Code Council. It is a model code for the establishment of minimum design and construction requirements for energy efficiency. |
|
LEED v4 |
Leadership in Energy and Environmental Design (LEED) is a green building certification program used worldwide. LEED was developed by the non-profit United States Green Building Council. NOTE: Energy Hub does not report the total building power factor, which is part of LEED. |
|
NEC Article 220.12 |
Article 220.12 is a table in the United States National Electrical Code that is focused on lighting loads. NOTE: Energy Hub does not send notifications for exceeding lighting demand based on illuminated floor area, which is part of NEC 220.12. |
|
NABERS Energy - Office buildings and tenancies |
NABERS (National Australian Built Environment Rating System) is an initiative by the government of Australia to measure and compare the environmental performance of Australian buildings and tenancies. NOTE: The NABERS rating functionality in Energy Hub is only available to users in Australia. |
Energy Hub supports the following standards-based energy usage types:
| Standard | Usage types |
|---|---|
|
ASHRAE Standard 90.1 |
Load: Supply: |
|
California Energy Code (Title 24) |
Load: Supply: |
|
International Energy Conservation Code (IECC) |
Load: Supply: |
|
LEED v4 |
Load: Supply: |
|
NEC Article 220.12 |
Load: Supply: |
|
Other |
Load: Supply: |
Standards-based monitoring includes the following data:
- Electric energy
- Water consumption
- Fuel gas consumption
There are no software-based alarm types for standards-based monitoring.
To learn more about alarming in Energy Hub, see Alarming.
For details on software-based alarms, see Software-based alarms.
Prerequisites
Verify that:
- You have an active Energy Hub subscription that includes this feature. For information on subscriptions, see Energy Hub subscriptions.
- Power monitoring devices are installed in your facility to monitor loads such as lighting, air conditioning, plug loads, and other consumers.
- (For water and gas monitoring) Water and gas monitoring devices are installed in your facility.
- The monitoring devices are connected to communication gateways, for example Site Server or Panel Server, that are sending measurement data to Energy Hub over the internet.
- The communication gateways have been added to your organization in Energy Hub.
NOTE: For Energy Hub to recognize a device as a water or gas meter, set the correct I/O Contextualization setting and the Commodity setting for the device in the Panel Server gateway. You can also set the Commodity setting in Energy Hub if it is not set correctly by Panel server. See Settings for information on the Commodity setting.
Configuration
[Web app]
- Associate the monitoring devices that are monitoring the loads and supplies with the locations in the organization model where these loads and supplies are located. For example, associating a device that is monitoring the lighting loads for floor 1 with the floor 1 location in the organization model.
- Assign usage types to the monitoring device to identify the types of load or supply that are being monitored.
- (Optional) To switch between active energy (kWh) and apparent energy (kVAh) displays, change the Energy mode setting for the monitored location.
[Mobile app]
There is no configuration for standards-based monitoring in the mobile app.
For step-by-step instructions on these configuration tasks, see energy code compliance tasks.
[Web app]
You can view standards-based consumption in the Energy view in Investigate.
Energy flow (shown in dark mode):
Energy consumption by usage type (shown in dark mode):
Energy flow (shown in dark mode):
Energy consumption by usage type (shown in dark mode):
[Mobile app – Site Manager mode only]
You can view standards-based consumption on the Energy tab.
Site energy consumption based on energy usage type (shown in dark mode):
|
|
|
Consumption tracking against target and by location (shown in dark mode):
|
|
|
Site energy consumption based on energy usage type (shown in dark mode):
Consumption tracking against target and by location (shown in dark mode):
For step-by-step instructions on how to view consumption, see viewing consumption and demand.
[Web app]
You can create a consumption report for standards-based monitoring by printing the data displays in the Energy view in Investigate, or by saving them as a PDF output. You can also export the data that is used in the displays in CSV file format.
[Mobile app]
There is no reporting for standards-based monitoring in the mobile app.
For step-by-step instructions on how to report on energy system data, see reporting tasks.
[Web app only]
NABERS![]() National Australian Built Environment Rating System is a building rating system for the environmental performance of Australian buildings and tenancies. It uses a star rating for building performance similar to the energy efficiency ratings for home appliances. With NABERS in Energy Hub, you can generate and view NABERS building rating estimates and download rating estimate reports.
National Australian Built Environment Rating System is a building rating system for the environmental performance of Australian buildings and tenancies. It uses a star rating for building performance similar to the energy efficiency ratings for home appliances. With NABERS in Energy Hub, you can generate and view NABERS building rating estimates and download rating estimate reports.
IMPORTANT: Energy Hub NABERS ratings are only estimates and are not official NABERS ratings.
NOTE: The NABERS rating functionality in Energy Hub is only available to users in Australia.
NABERS rating system
NABERS can provide energy, water, waste, and indoor environment ratings for offices, hotels, data centers, and other building types. Energy Hub only supports the NABERS energy for office buildings rating system. For more information on the NABERS rating system, visit the NABERS website.
NABERS in Energy Hub
Energy Hub supports the NABERS energy for office buildings rating system. The ratings generated by Energy Hub are estimates that are based on the NABERS assessment standards. These estimates are not official ratings.
Use Energy Hub NABERS rating estimates to gain an understanding of the energy performance of your buildings and how they might rank on the NABERS star rating system. Receiving an official NABERS rating requires an assessment by an accredited assessor and certification by the National Administrator, which is not within the scope of the NABERS functionality provided in Energy Hub.
For detailed information on the rating inputs, such as rated area or rated hours, see the NABERS Energy and Water for Offices Rules on the NABERS website.
NABERS rating scope
NABERS energy for office buildings defines the following rating scopes to specify the building spaces that are included in a rating:
| Base building | – Includes central building services, such as heating, cooling, and common areas. |
| Whole building | – Includes the entire building, meaning central services, common areas, and tenant spaces. |
| Tenancy | – Includes the office tenant spaces. |
NABERS rating period
The NABERS rating period is one year. You can set the rating period when you create a new NABERS rating or when you edit an existing rating. All you need to enter is the rating period end date, and Energy Hub automatically determines the correct start date. The rating period starts at the beginning of the start date day, at midnight, and ends at the end of the end date day, just after midnight.
NABERS star ratings
A NABERS rating is a number between - infinity and 6.50, with two decimal places. A NABERS star rating is a rounded NABERS rating between 0 and 6 in 0.5 star increments, except there is no 0.5 star rating.
Rounding rules:
| Rating | Star rating | Example |
|---|---|---|
| - infinity ≤ Rating ≤ 0.50 | 0 | 0.35 → 0 stars |
| 0.51 ≤ Rating ≤ 1.00 | 1 | 0.68 → 1 star |
| 1.01 ≤ Rating ≤ 1.50 | 1.5 | 1.20 → 1.5 stars |
| 1.51 ≤ Rating ≤ 2.00 | 2 | 1.71 → 2 stars |
| x.01 ≤ Rating ≤ x.50 | x.5 | 4.23 → 4.5 stars |
| x.51 ≤ Rating ≤ y.00 | y | 4.60 → 5 stars |
| 6.01 ≤ Rating | 6 | 6.25 → 6 stars |
Star rating to building performance mapping:
| Star rating | Building performance |
|---|---|
|
|
Making a start |
|
|
Below average |
|
|
Average |
|
|
Good |
|
|
Excellent |
|
|
Market leading |
Backfilling of energy consumption data for NABERS
- The purpose of NABERS data backfilling is to estimate consumption for rating periods that begin before recorded data is available for a building. Backfilling only addresses data gaps at the start of a rating period; it does not fill gaps in the middle or at the end caused by data logging issues.
- Energy Hub requires at least seven full (24-hour) days of measured data to perform backfilling.
One input for a NABERS building rating is the building's yearly energy consumption. In Energy Hub, you need to manually enter non-electric energy consumption, such as fuel gas or diesel. For electric consumption, you can enter data manually or have Energy Hub automatically provide the data. If you use consumption data from Energy Hub and there is missing data at the beginning of the rating period, then Energy Hub backfills the missing data using estimates based on the average daily consumption. It uses the following estimation method: Estimated yearly kWh = (total logged kWh ÷ days of logged data) × days in rating period.
Example:
(250 days of data and 10,000 kWh logged energy in Energy Hub):
Estimated yearly kWh = (10,000 kWh ÷ 250) × 365 = 40 kWh × 365 = 14,600 kWh
NABERS includes the following data:
- Electric energy
There are no software-based alarm types for NABERS. To learn more about alarming in Energy Hub, see Alarming.
Prerequisites
Verify that:
- You have an active Energy Hub subscription that includes this feature. For information on subscriptions, see Energy Hub subscriptions.
- Power monitoring devices are installed in your facility to monitor loads such as lighting, air conditioning, plug loads, and other consumers.
- The monitoring devices are connected to communication gateways, for example Site Server or Panel Server, that are sending measurement data to Energy Hub over the internet.
- The communication gateways have been added to your organization in Energy Hub.
- Loads and supplies have been configured and usage types have been assigned.
Configuration
- Verify that the country setting for your organization in Energy Hub is set to Australia.
- Enter valid Australian street addresses for the buildings you want to create NABERS ratings for.
- Add buildings from your organization model in Energy Hub to NABERS.
- Create NABERS ratings for the buildings.
For step-by-step instructions on these configuration tasks, see energy code compliance tasks.
Optimizing the Energy Hub organization model for NABERS
Following certain best practices when setting up your organization model in Energy Hub makes it possible to use Energy Hub consumption data, instead of manually entered data, when creating NABERS ratings. For information on how to set up the organization model for use with NABERS, see Special organization setup.
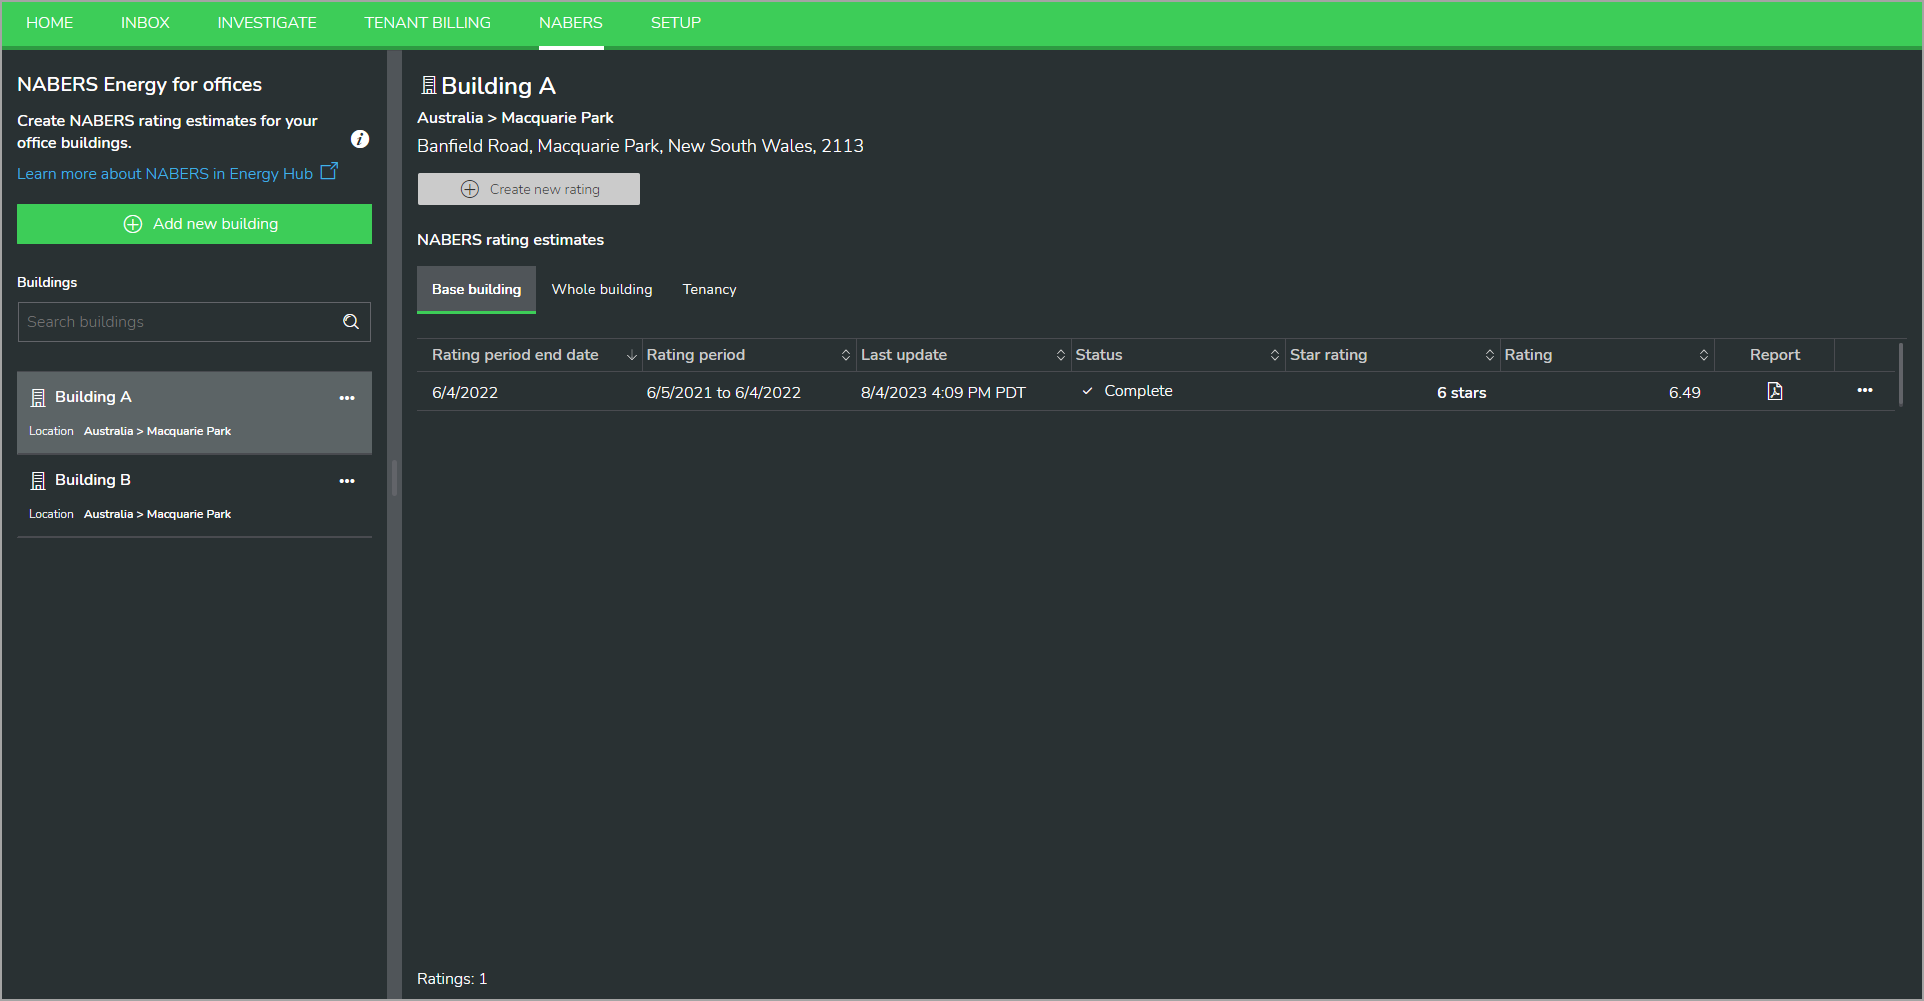
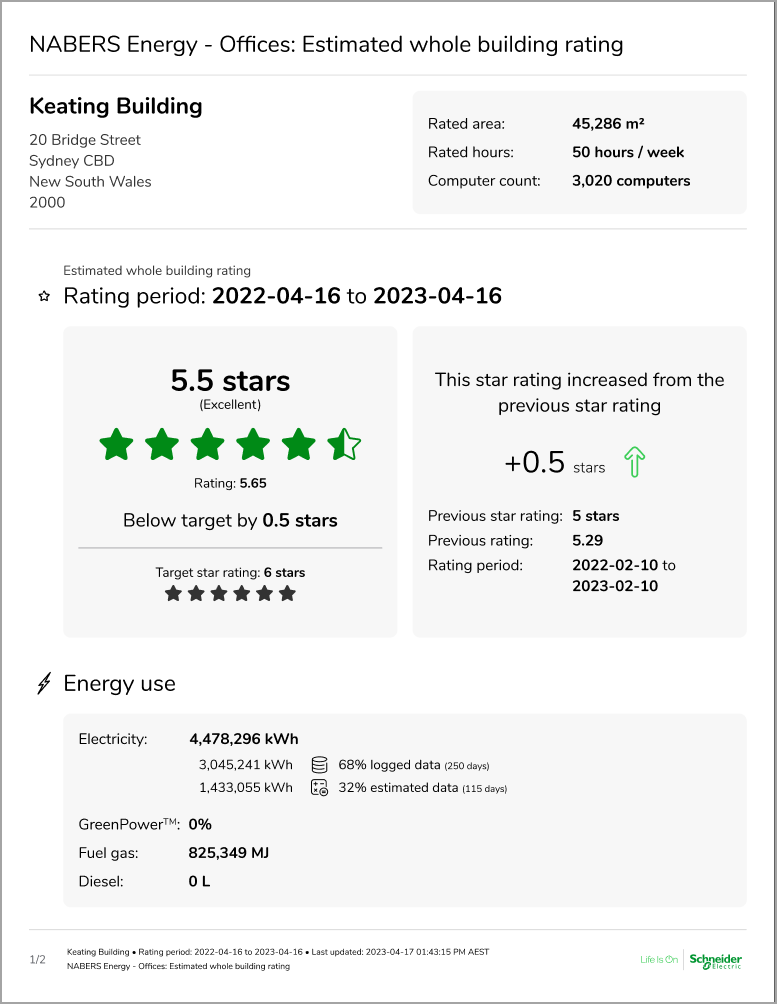
You can view NABERS ratings in the NABERS ratings manager, in NABERS. For step-by-step instructions on how to view NABERS ratings, see viewing NABERS ratings.
NABERS ratings example (shown in dark mode):

You can download NABERS rating reports. For step-by-step instructions on how to report on NABERS, see reporting tasks.
[Web app only]
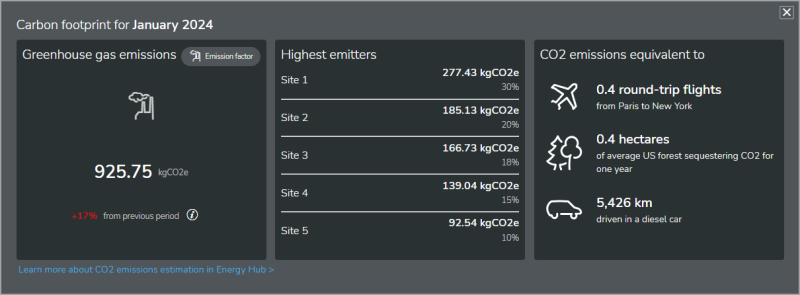
CO2 emissions monitoring estimates the CO2e emissions for the organization based on the total electrical energy consumption. You can view emissions for the top contributing sites or loads for different time ranges.
Top contributors
The emissions display includes information on the sites or loads that contribute the most to the emissions. For organizations with multiple sites, it shows the top contributing sites; for organizations with a single site, it shows the top contributing loads.
Emissions factor
The emissions factor used to estimate the CO2e emissions is based on the country selection in the organization settings in Energy Hub.
Energy Hub uses the following sources for emissions factors:
| Country / Region | Emissions factor source |
|---|---|
|
Australia |
Australian Government National Greenhouse Account Factors |
|
Canada |
Environment Canada - National Inventory Report |
|
US |
US EPA eGRID |
|
World |
International Energy Agency (IEA) - CO2 Emissions from Fuel Combustion |
Emissions equivalents
The emissions display includes a comparison of the emissions with everyday examples, such as driving a car or taking a flight with an airplane.
Energy Hub uses the following sources for the equivalency calculations:
| Equivalency | Conversion factor source |
|---|---|
|
Round-trip flight (Paris – New York) |
UK Department for Energy Security and Net Zero (2019) |
|
Forest sequestration (yearly) |
United States Environmental Protection Agency (2022) |
|
Driving distance (Diesel car) |
UK Department for Energy Security and Net Zero (2019) |
Greenhouse gas emissions monitoring includes the following data:
- CO2e emissions
There are no software-based alarm types for Greenhouse gas emissions monitoring. To learn more about alarming in Energy Hub, see Alarming.
Prerequisites
Verify that:
- You have an active Energy Hub subscription that includes this feature. For information on subscriptions, see Energy Hub subscriptions.
- Power monitoring devices are installed in your facility to monitor loads such as lighting, air conditioning, plug loads, and other consumers.
- The monitoring devices are connected to communication gateways, for example Site Server or Panel Server, that are sending measurement data to Energy Hub over the internet.
- The communication gateways have been added to your organization in Energy Hub.
- Loads and supplies have been configured and usage types have been assigned.
Configuration
Confirm that the country setting for your organization in Energy Hub is correct. The country setting is used to determine the emissions factor for the greenhouse gas emission estimates.
For step-by-step instructions on how to check the country setting, see To edit organization settings.
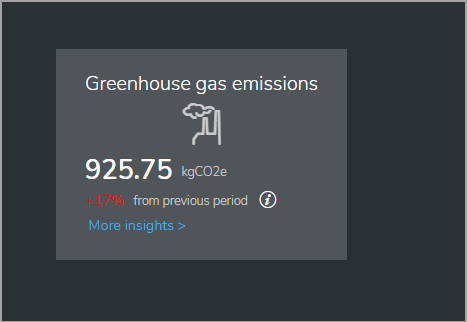
You can view greenhouse gas emissions on the Home page. For step-by-step instructions on how to view greenhouse gas emissions, see viewing greenhouse gas emissions.
Examples:
Summary view (shown in dark mode):
Details view (shown in dark mode):
Details view (shown in dark mode):

Printing and CSV export are not available for greenhouse gas emissions data displayed on the Home page.
- On-site generation uses utility power and locally generated power together at the same time.
- Dual-source systems use either utility power or locally generated power, but not both together at the same time.
[Web app only]
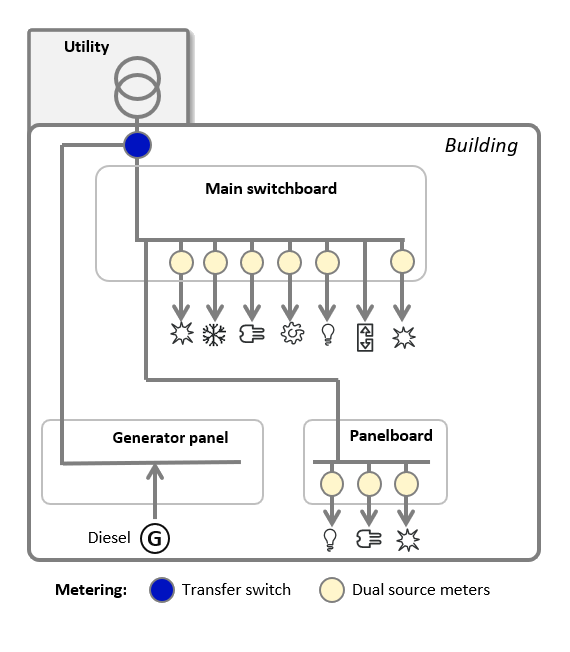
On-site generation is the local production of electricity at your facility to offset utility provided grid power. On-site generation can include renewable energy sources such as solar power, and it can include conventional sources like diesel and gas-powered generation. On-site generation monitoring shows energy and cost information on local production, local consumption, and sell-back of excess energy to the utility grid.
NOTE: On-site generation uses utility power and locally generated power together at the same time.
Supported on-site generation types
Energy Hub only supports on-site generation that is connected to a main incoming feeder at a building or site level. Connections at downstream locations, such as at a floor-level panelboard, are not supported.
The following diagram shows the supported connection type for on-site generation for a building:
Calculating energy costs for systems with on-site generation
Where some or all of the on-site generated energy is consumed locally, Energy Hub uses an adjusted electricity rate for calculating energy costs. The adjusted rate is a reduced utility rate that accounts for the cost savings from local generation.
On-site generation includes the following data:
- Electric energy
- Electricity cost (savings, sell-back credits)
There are no software-based alarm types for On-site generation. To learn more about alarming in Energy Hub, see Alarming.
Prerequisites
Verify that:
- You have an active Energy Hub subscription that includes this feature. For information on subscriptions, see Energy Hub subscriptions.
- Power monitoring devices are installed in your facility to monitor loads such as lighting, air conditioning, plug loads, and other consumers.
- The monitoring devices are connected to communication gateways, for example Site Server or Panel Server, that are sending measurement data to Energy Hub over the internet.
- The communication gateways have been added to your organization in Energy Hub.
- Bi-directional monitoring devices are used for monitoring the utility supply and the local generation.
- The incoming utility supply and the local generation are connected at the same level of the site or building electrical system.
- There is no bi-directional power flow on any of the feeders downstream from the utility / local generation connection point.
Configuration
- Assign an energy usage type of Total energy to the devices that are monitoring the utility incomers to your site or building.
- Assign a supply energy usage type, such as Renewable power source or Genset, to the devices that are monitoring the local generation.
- (If necessary) Change the Meter wiring is reversed setting for the local generation monitoring devices (see below).
Energy Hub expects a generation monitoring device to be wired as a supply monitoring device. That means the current instrument transformers (CTs) are connected to measure generated energy as delivered (positive) and consumed energy as received (negative).
A correctly wired generation monitoring device will show a large energy generation and no, or only a small energy consumption in Energy Hub. If the device is showing a large energy consumption and no, or a small generation, then the device wiring might be reversed. You can verify this by checking the Energy consumption and generation display for the device in Energy view. To compensate for reverse wiring, set the Meter wiring is reversed setting for the device in Energy Hub to Yes. For more information on reversed meter wiring, see Troubleshooting.
- (Optional) Set an electricity sell-back rate if you are selling on-site generated energy back to the utility grid.
For step-by-step instructions on these configuration tasks, see on-site generation monitoring tasks.
You can view consumption and generation in the Energy view and the Cost view in Investigate. For step-by-step instructions on how to view on-site generation consumption, see viewing consumption and demand.
Examples:
Energy flow (shown in dark mode):
Energy consumption and generation (shown in dark mode):
Energy consumption and generation (shown in dark mode):
You can create a consumption report for on-site generation by printing the data displays in the Energy view in Investigate, or by saving them as a PDF output. You can also export the data that is used in the displays in CSV file format. For step-by-step instructions on how to report on energy system data, see reporting tasks.
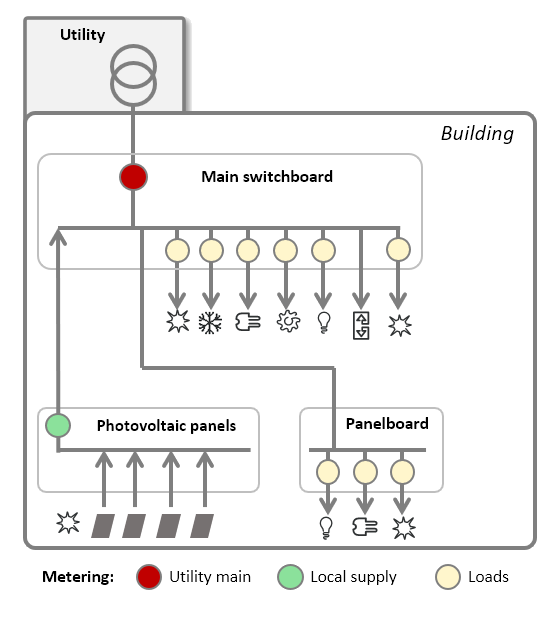
[Web app only]
Dual-source systems are energy systems that alternate between two different energy supply sources. These supply sources can include utility power and on-site generation, such as renewable energy systems or diesel and gas-powered generation. Dual-source monitoring shows the energy consumed by a load from each of the supply sources.
NOTE: Dual-source systems use either utility power or locally generated power, but not both together at the same time.
Supported monitoring device types
Energy Hub supports installations using Conzerv EM6438H and EasyLogic PM1130H meters with dual-source monitoring capability.
Supported dual-source system types
Dual-source monitoring in Energy Hub monitors loads that are downstream from the utility feed and the local generation. It does not monitor the utility feed or local generation itself.
The following diagram shows the supported type of dual-source monitoring:
Dual-source systems includes the following data:
- Electric energy
There are no software-based alarm types for Dual-source systems monitoring. To learn more about alarming in Energy Hub, see Alarming.
Prerequisites
Verify that:
- You have an active Energy Hub subscription that includes this feature. For information on subscriptions, see Energy Hub subscriptions.
- Power monitoring devices are installed in your facility to monitor loads such as lighting, air conditioning, plug loads, and other consumers.
- The monitoring devices are connected to communication gateways, for example Site Server or Panel Server, that are sending measurement data to Energy Hub over the internet.
- The communication gateways have been added to your organization in Energy Hub.
- Dual-source monitoring devices are used for monitoring the loads in the system.
Configuration
Set the Dual source meter setting for all dual source monitoring devices in Energy Hub to Yes.
For step-by-step instructions on this configuration task, see dual-source system monitoring tasks.
You can view consumption and generation in the Energy view in Investigate. For step-by-step instructions on how to view dual-source consumption, see viewing consumption and demand.
Example:
Energy consumption and generation (shown in dark mode):
You can create a consumption report for dual-source systems by printing the data displays in the Energy view in Investigate, or by saving them as a PDF output. You can also export the data that is used in the displays in CSV file format. For step-by-step instructions on how to report on energy system data, see reporting tasks.